One map, from the first layer to the printed sheet
This is one real map, built in order. Half a square kilometre of Cyprus, 400 objects, traced over satellite imagery in a browser tab. Here is every step, mostly in pictures.
 Andrey Surzhikov
Anavargos, on the west coast of Cyprus. The finished map covers 0.77 by 0.73 kilometres, which is 0.56 km², and holds 400 objects: 161 trees and bushes, 85 buildings, 57 roads and paved areas, 45 patches of vegetation, 21 fences. Roughly 700 objects to the square kilometre, which is what a sprint map looks like when it is done properly.
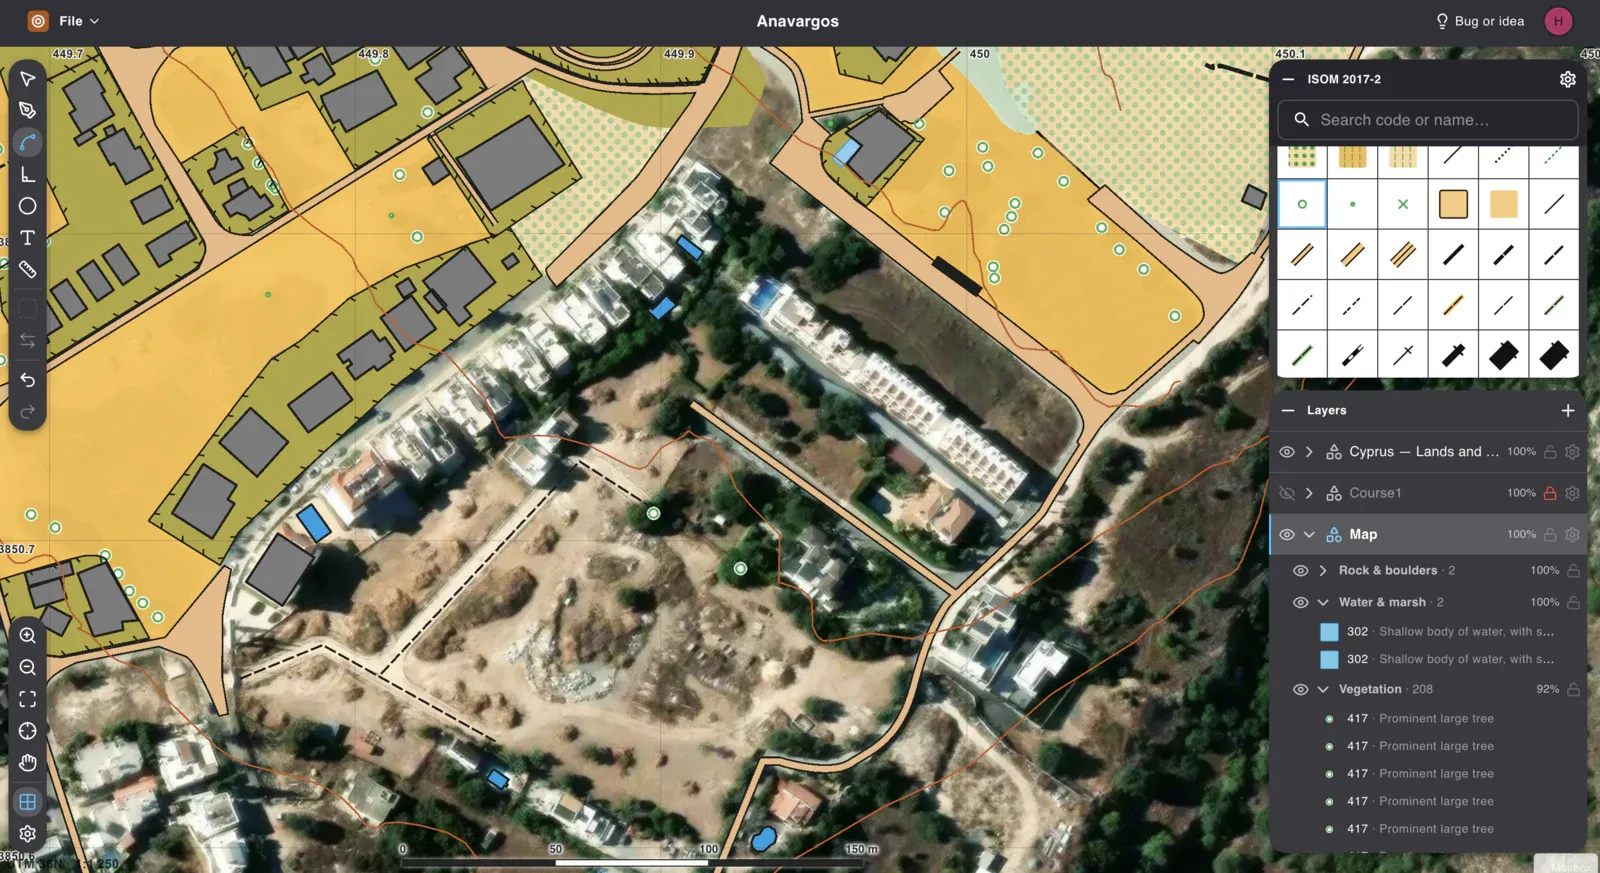
The screen
The editor in these pictures is Gratic.
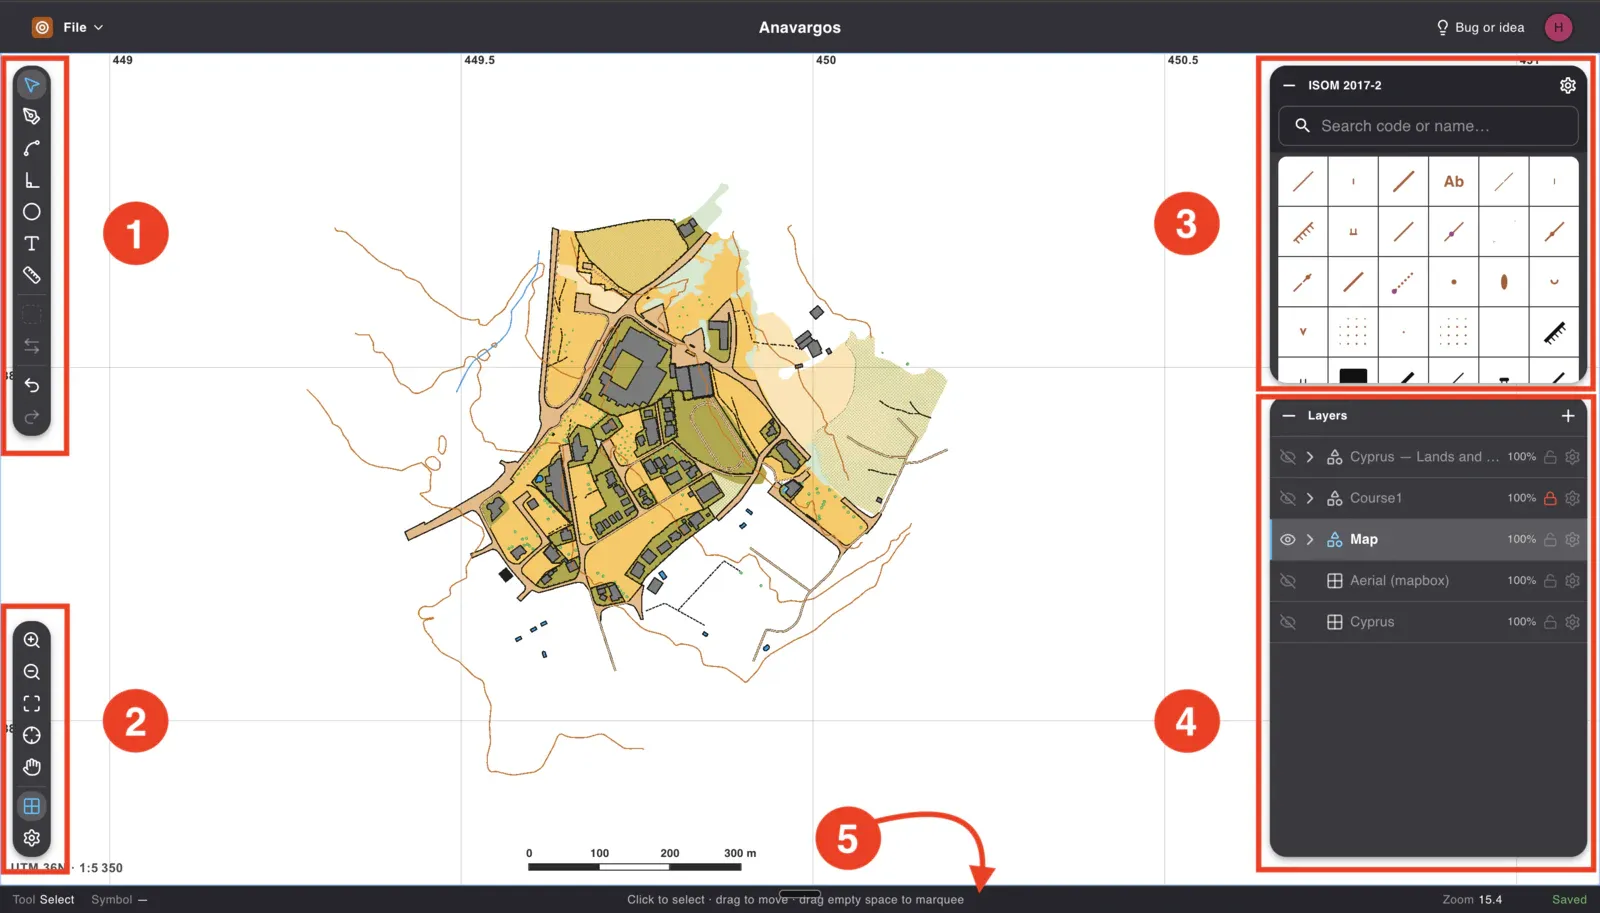
- Drawing and editing. Select, pen, smooth curve, right angles, ellipse, text, measure, and the node editor. Undo and redo at the bottom.
- The view. Zoom, fit to the map, find my location, pan, the grid, and the project settings where the scale, the north and the declination live.
- The symbol set. Everything ISOM 2017-2 defines, searchable by code or by name. Picking one here is what decides how the next thing you draw behaves.
- The layers. The imported survey, the course, your drawing, the backdrops. Each with its own visibility, lock and opacity, and expandable into the symbol categories inside it.
- The status bar. Which tool and which symbol you are holding, what the tool does right now, the zoom, and whether the map is saved.
Start with something underneath
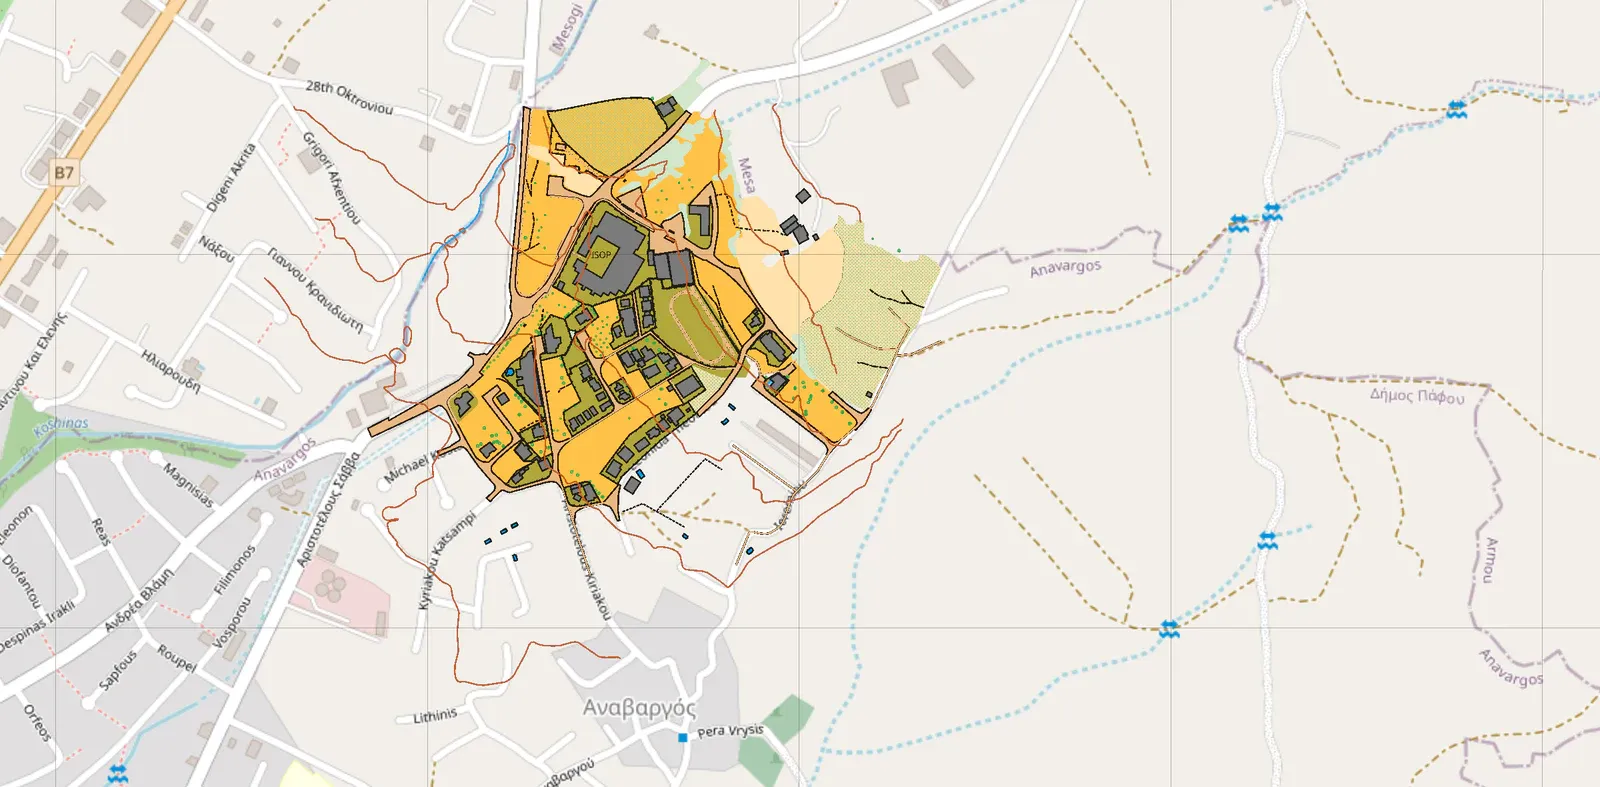
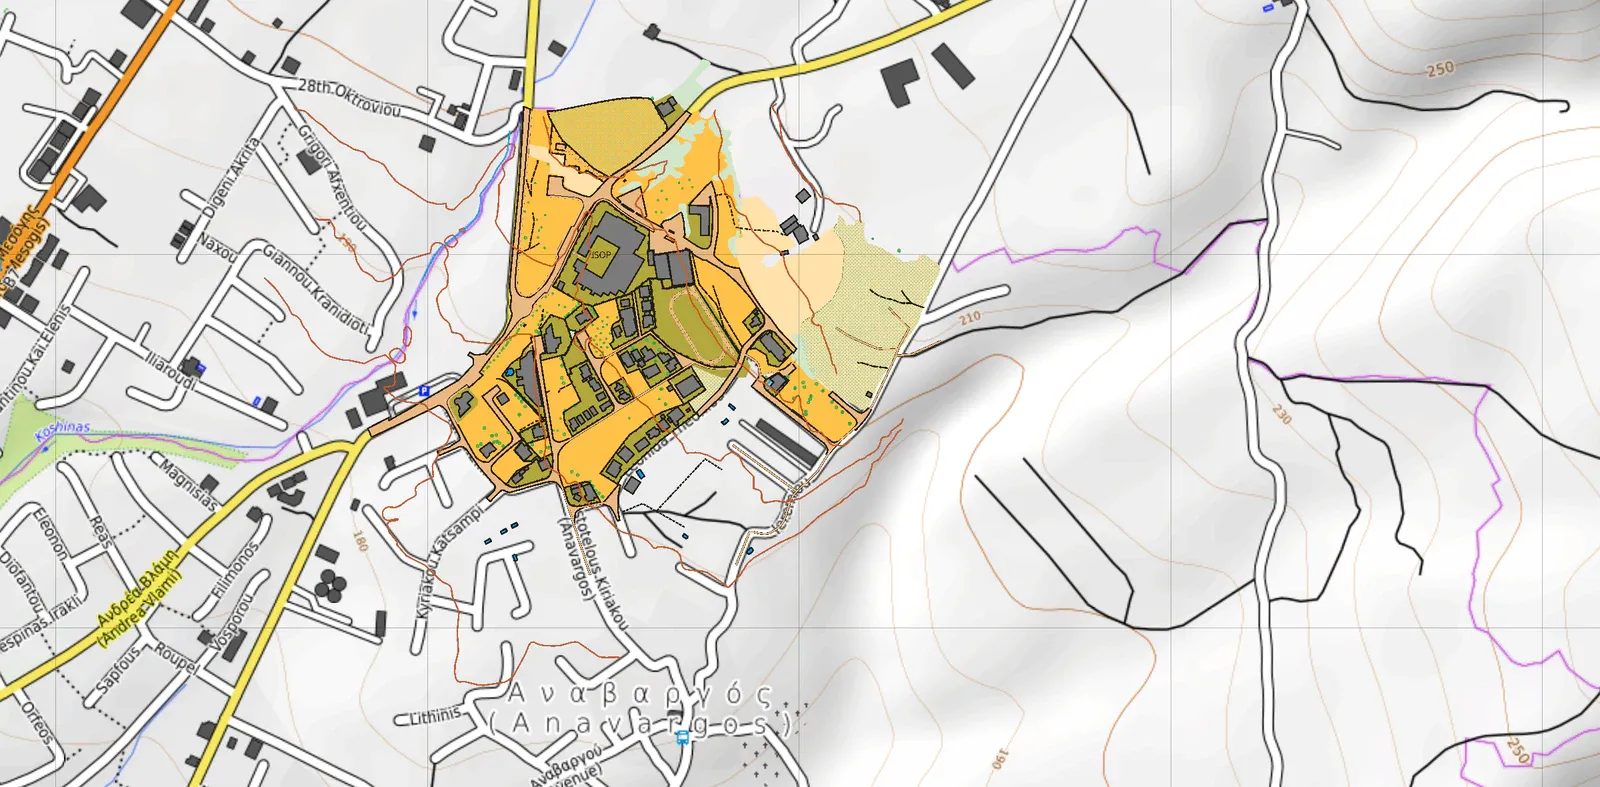
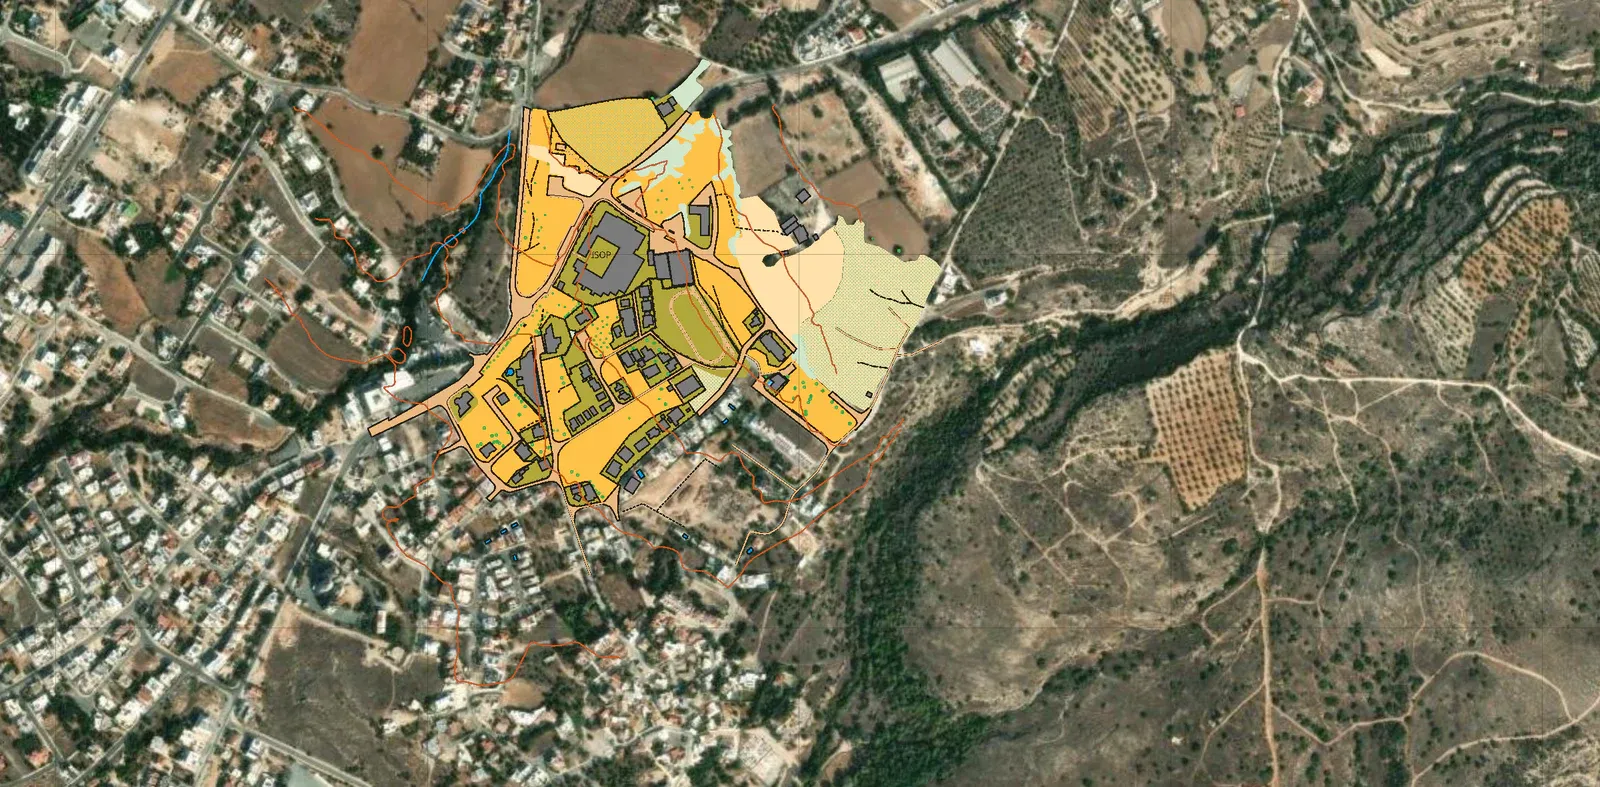
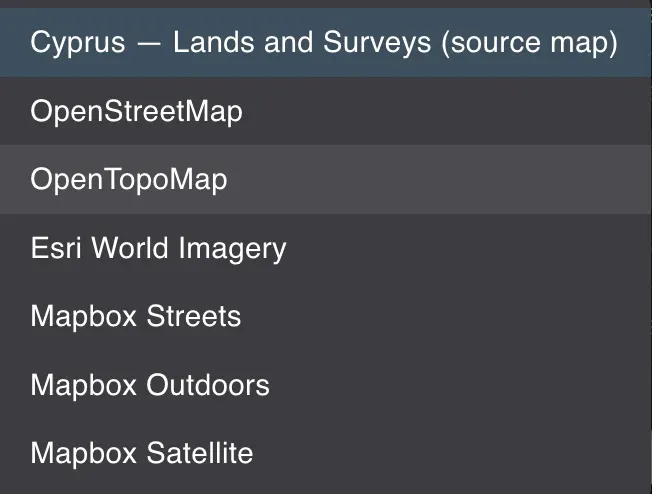
The backdrop can come from anywhere: a source from the list, any tile address you paste in, or your own file — a drone survey saved as GeoTIFF lands on its own coordinates
There is a list to pick from, and if what you want is not in it, the tile address goes in a field. Your own file works too: a GeoTIFF carries its coordinates inside, so a drone survey of your own terrain lands in the right place with nothing to align. The project has to be saved first, because the file goes to the server to be decoded.
Backdrops stack like anything else, and switching between them is one click. The drawing does not move.
Then take what the state already surveyed
National data arrives on its own layer, so the contours and roads are already in place before you draw a line
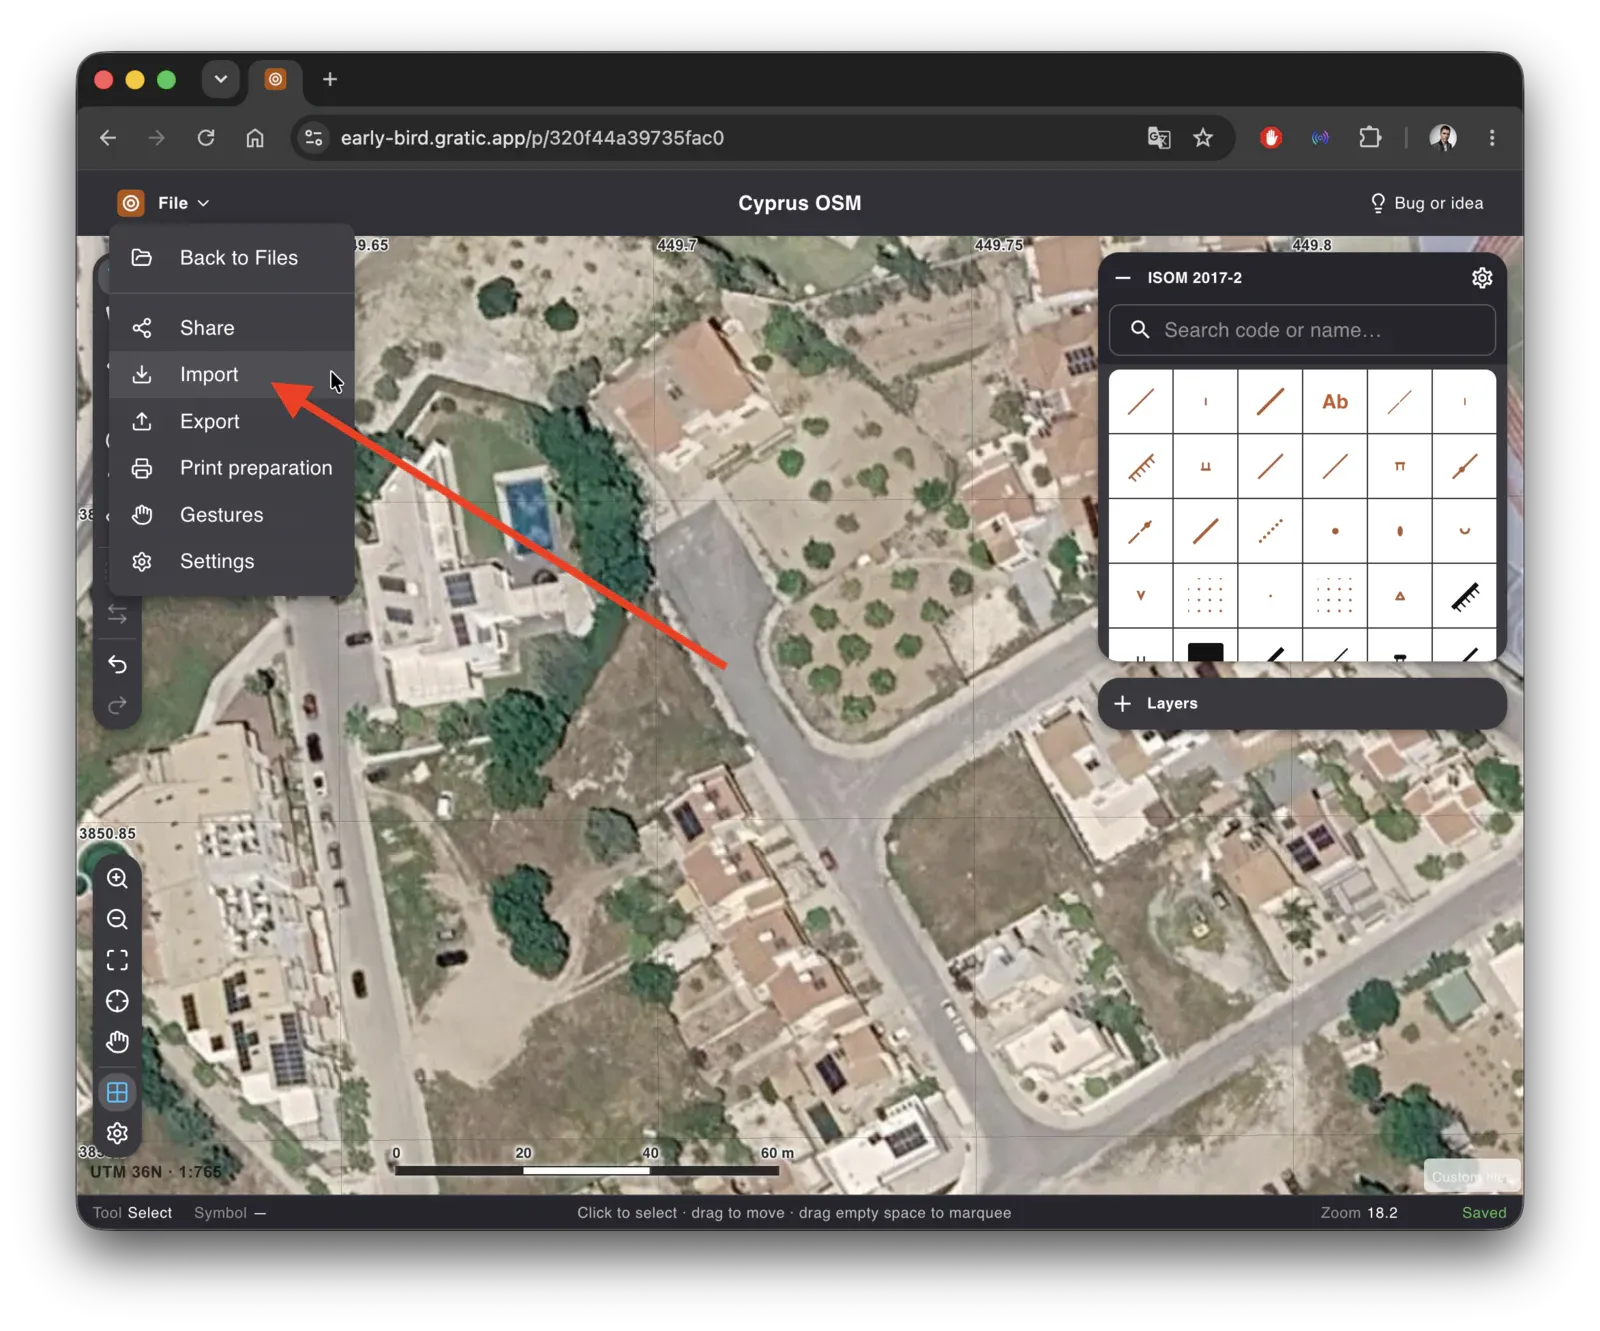
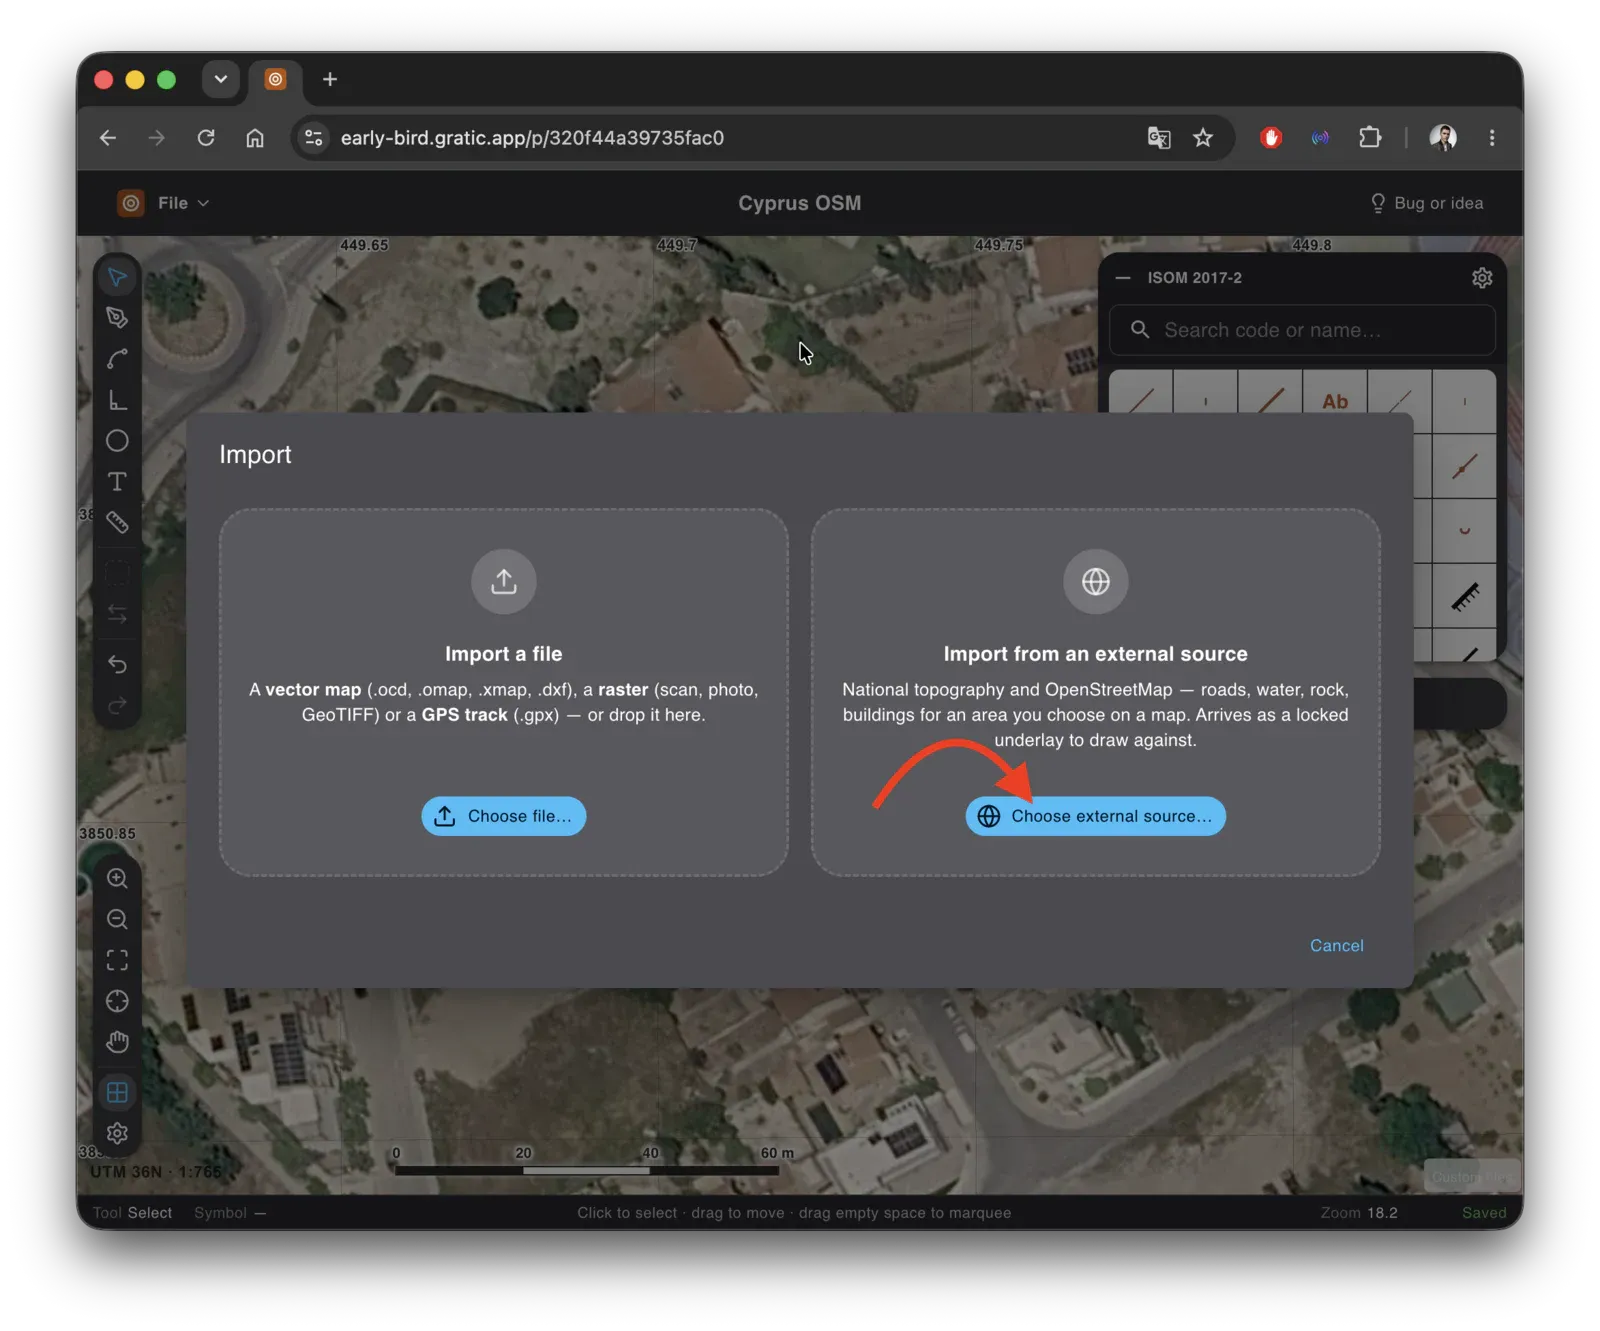
Import, then an external source rather than a file.
Each source carries its licence and its size limit on the card, before you choose it.
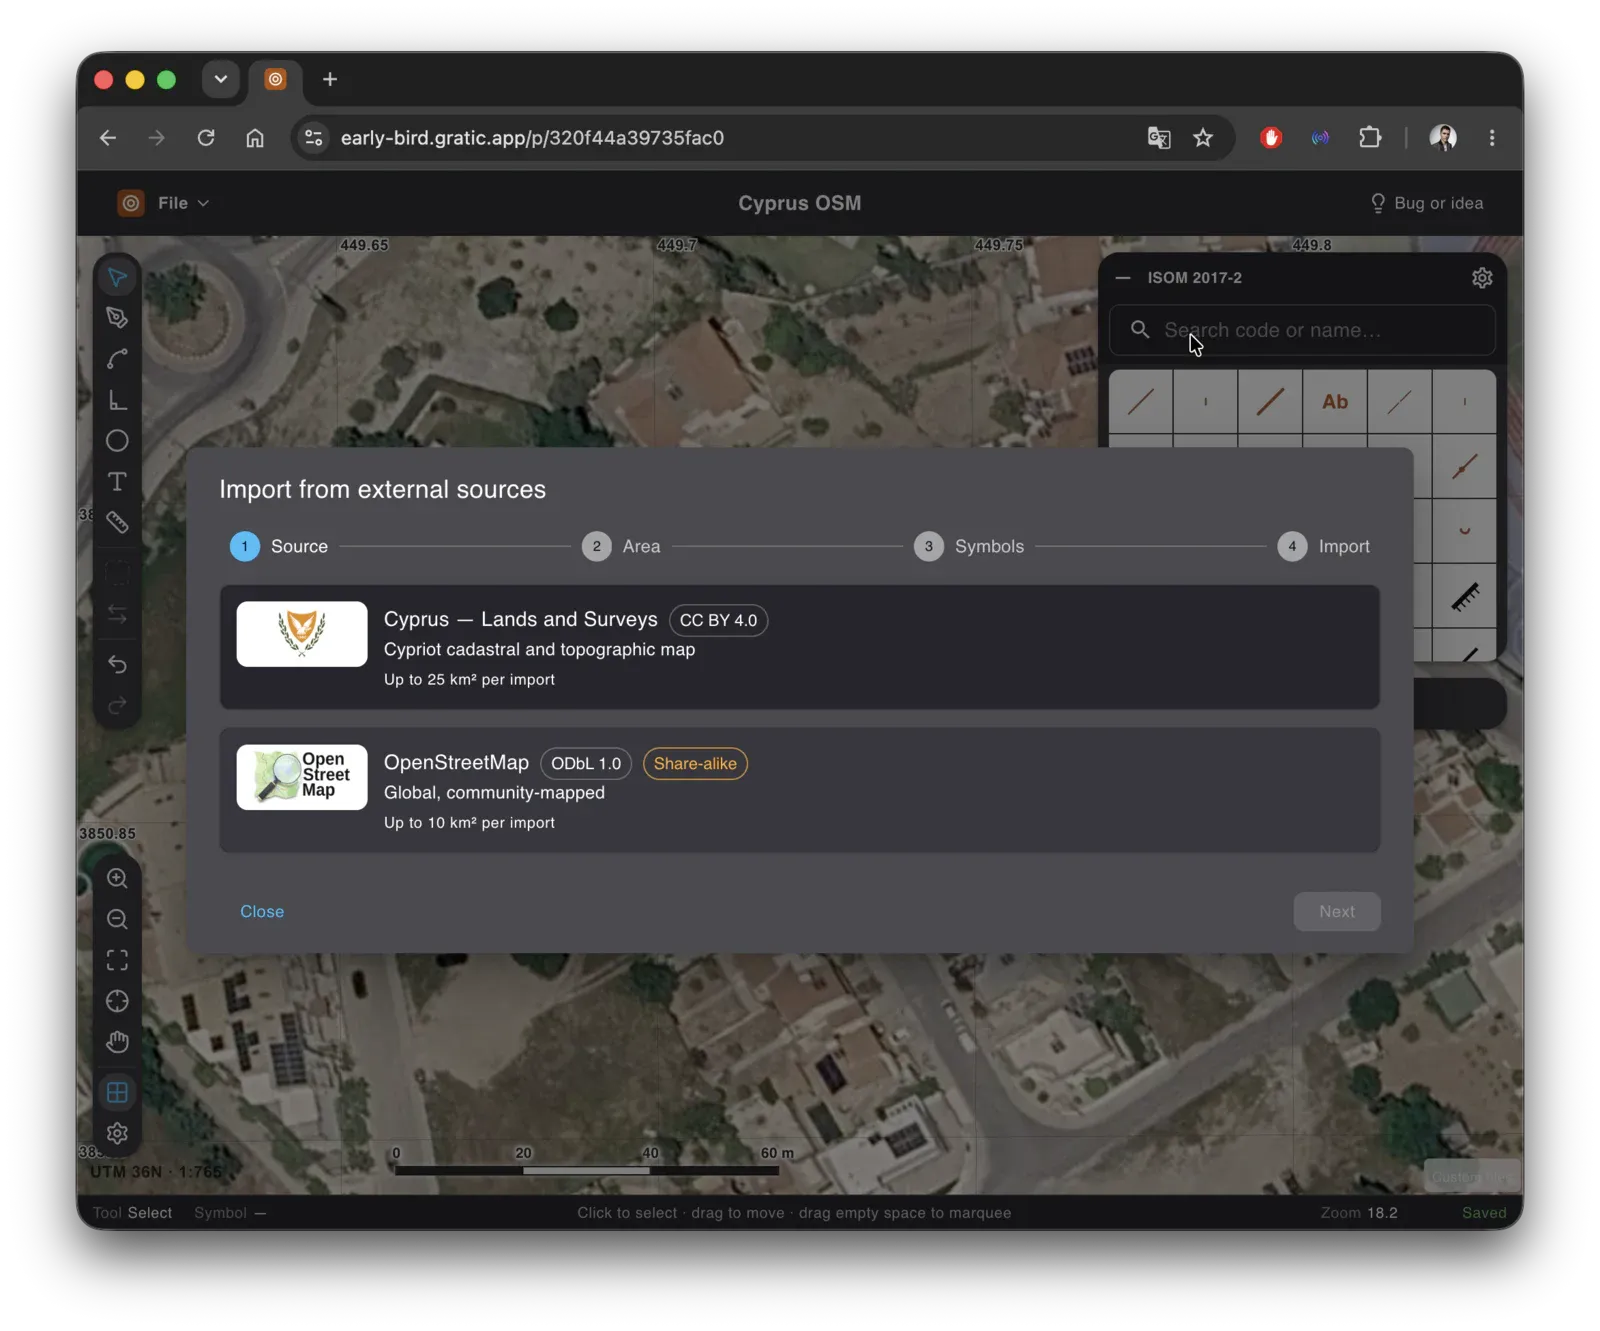
Which sources reach your own terrain is a question the list answers and an article cannot: open a map and it shows the ones that cover the area on screen.
Choosing the area
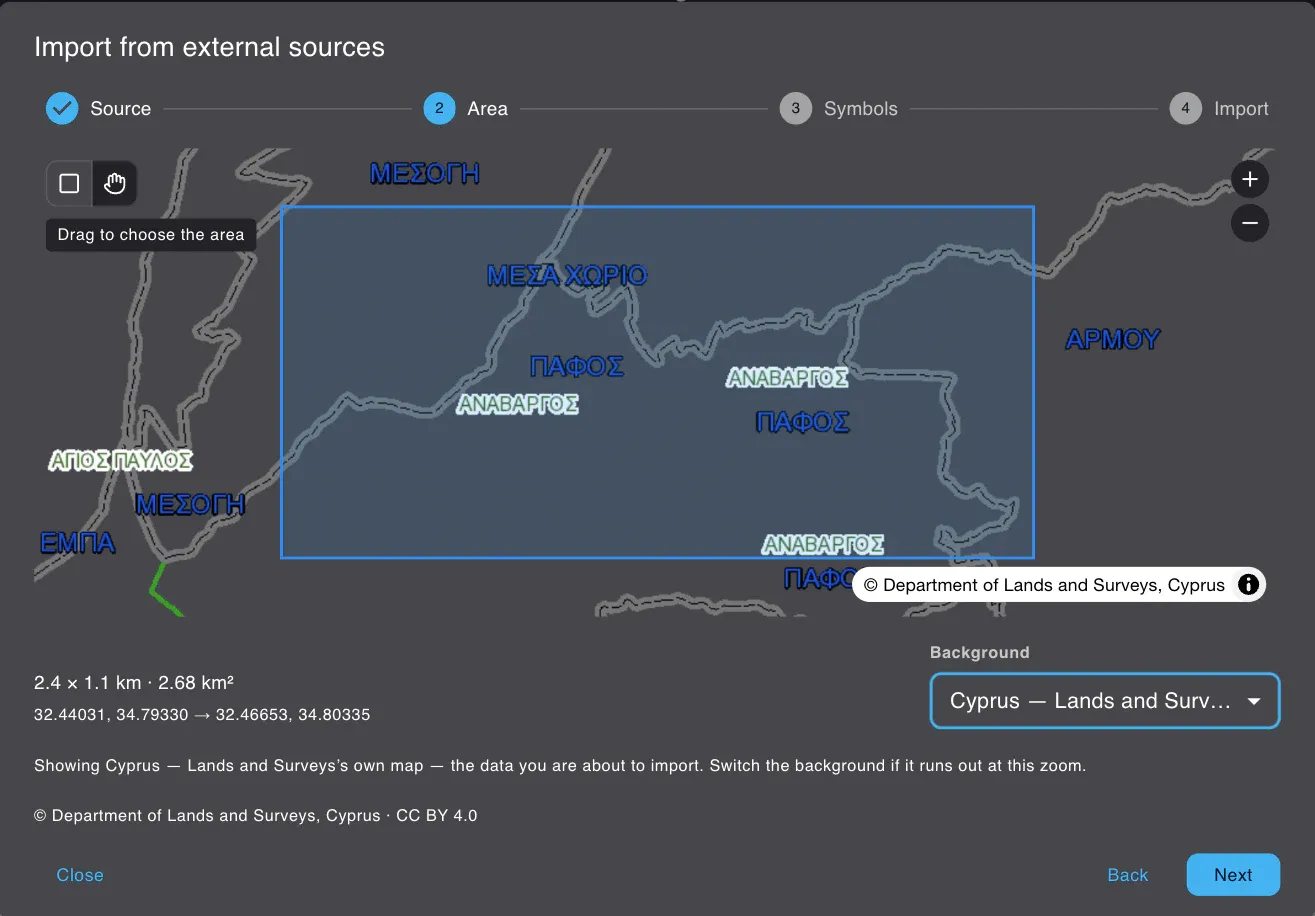
You drag a rectangle over the area you want. The backdrop under that rectangle is the source’s own map, so what you see is what you are about to take, and the readout gives the size on the ground.
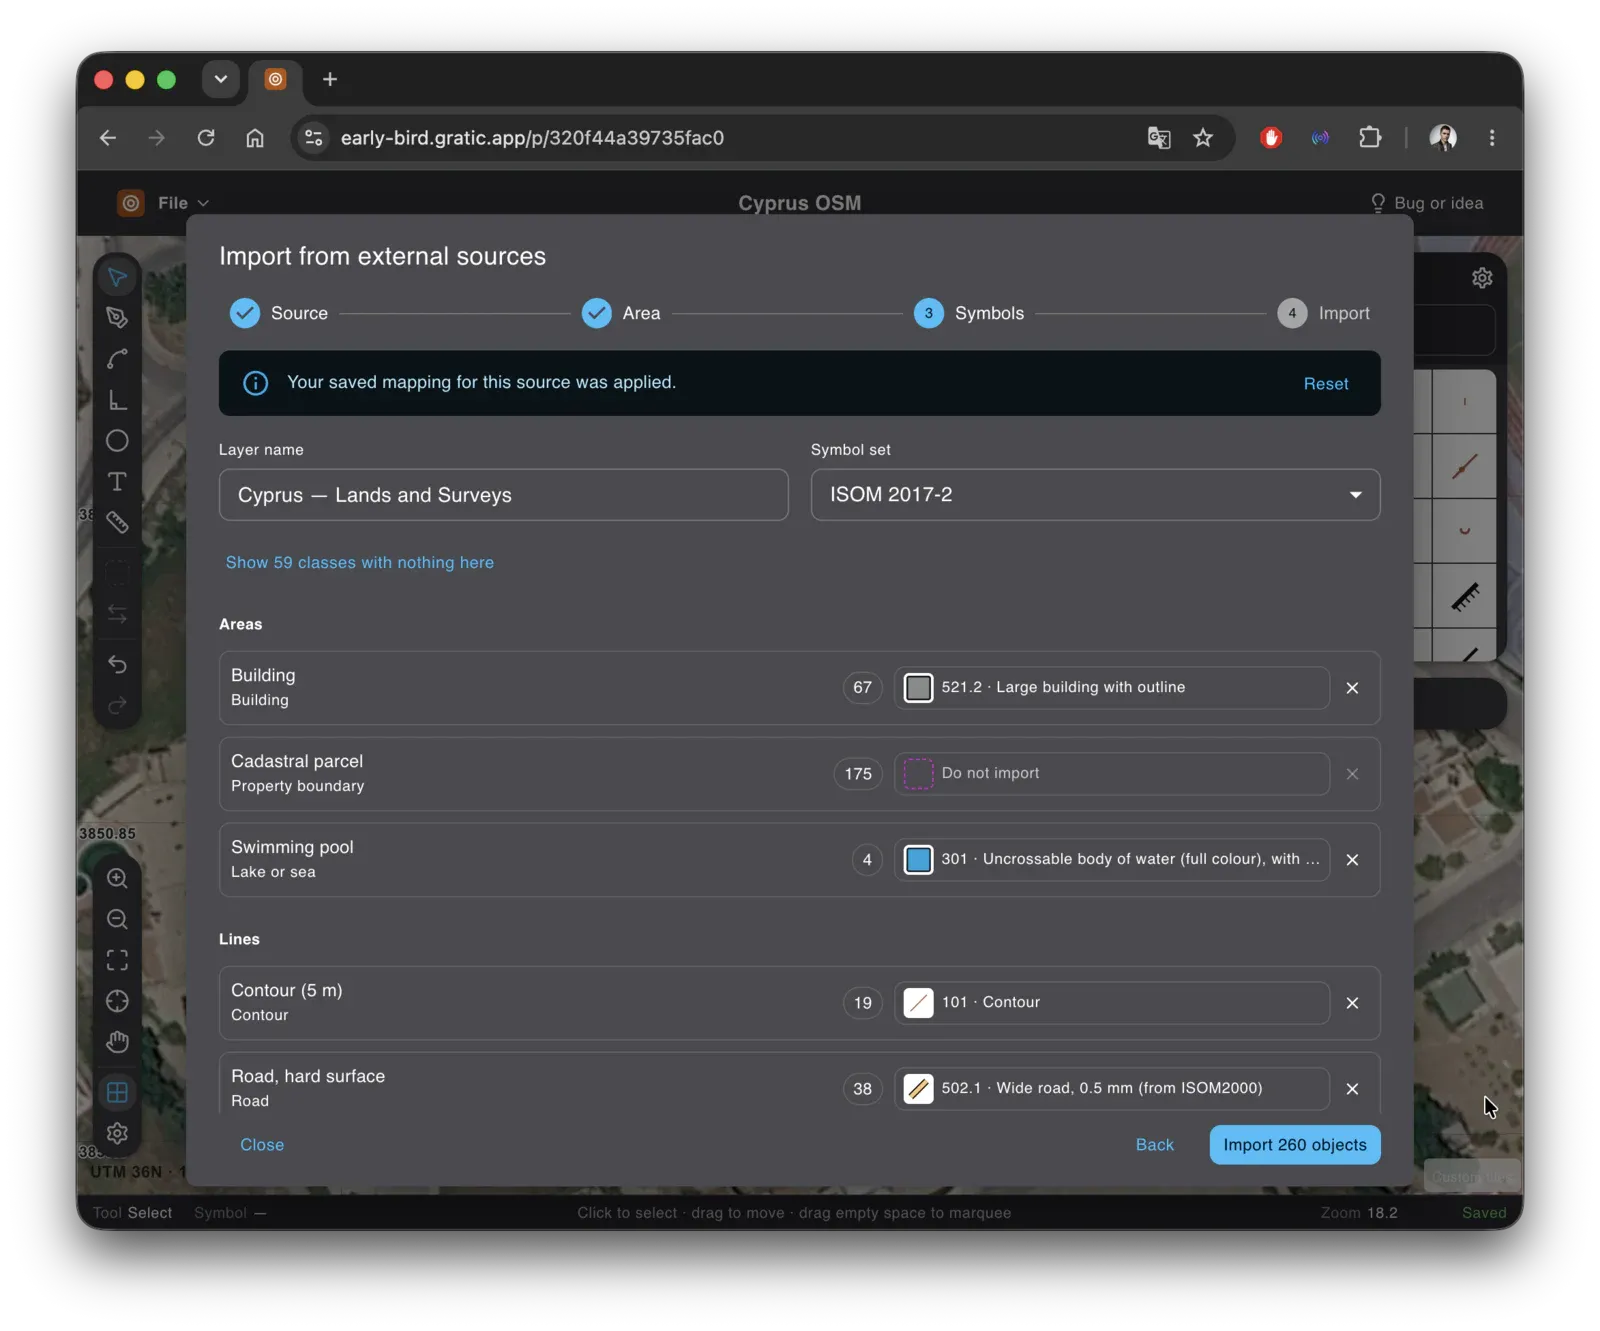
Then every class in the source gets a symbol, with the number of objects that class actually holds inside your rectangle. Classes you do not want go to “Do not import” and the total on the button drops.
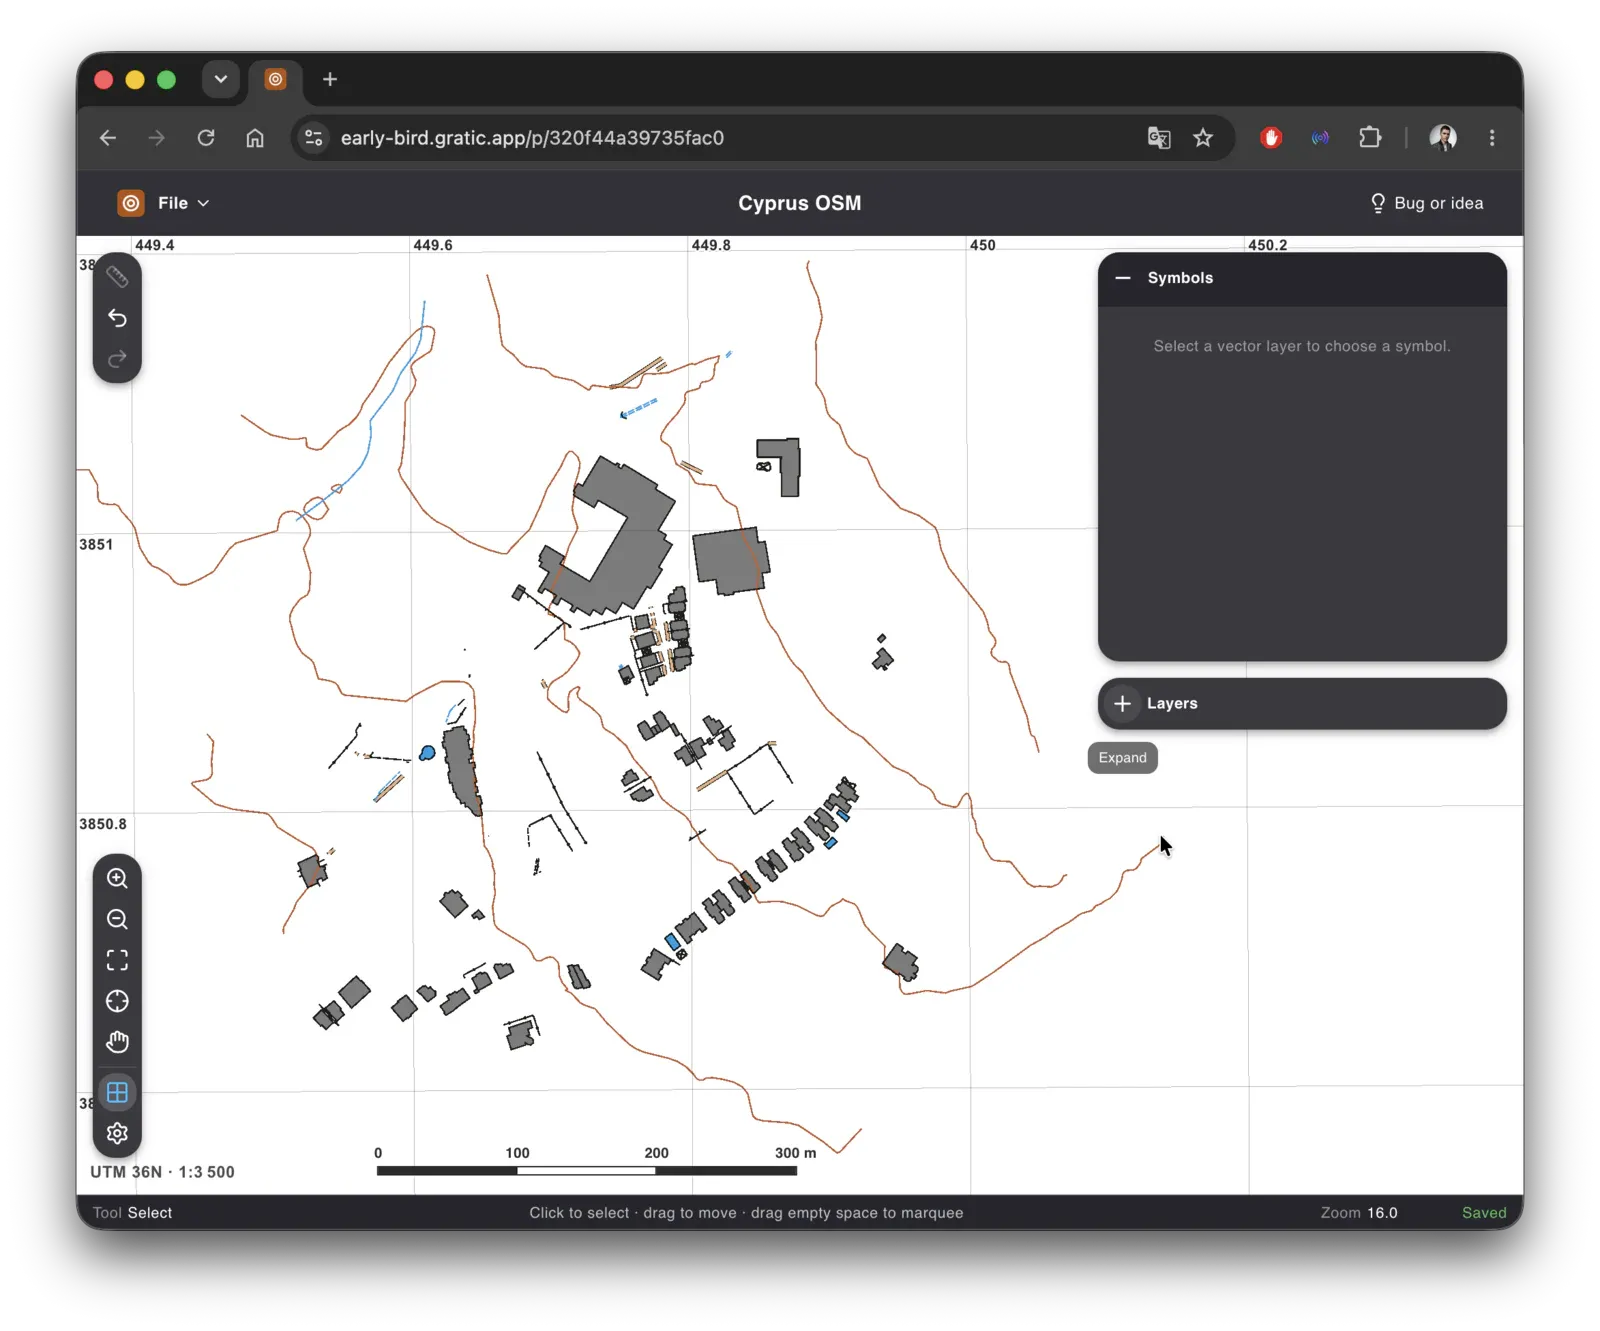
What you keep from that layer you move onto your own, and the rest you delete: an import is raw material, not a result
An import is a survey, not a map. Some of it is exactly right and moves across to the layer you draw on. Some of it is at the wrong scale, or drawn to a different standard, or not true any more. That part gets deleted — and whatever the map still needs there, you draw by eye against the imagery.
Moving what you keep
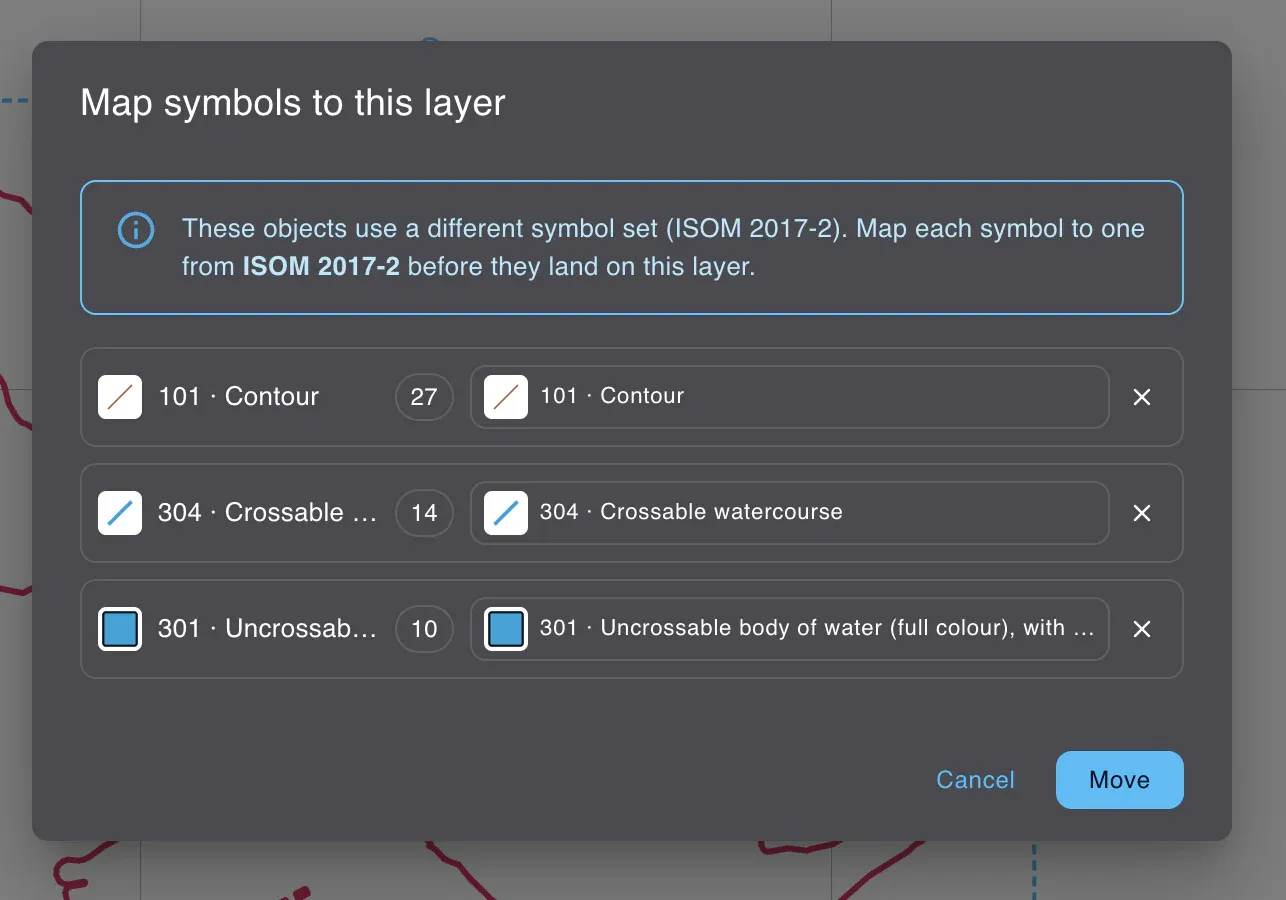
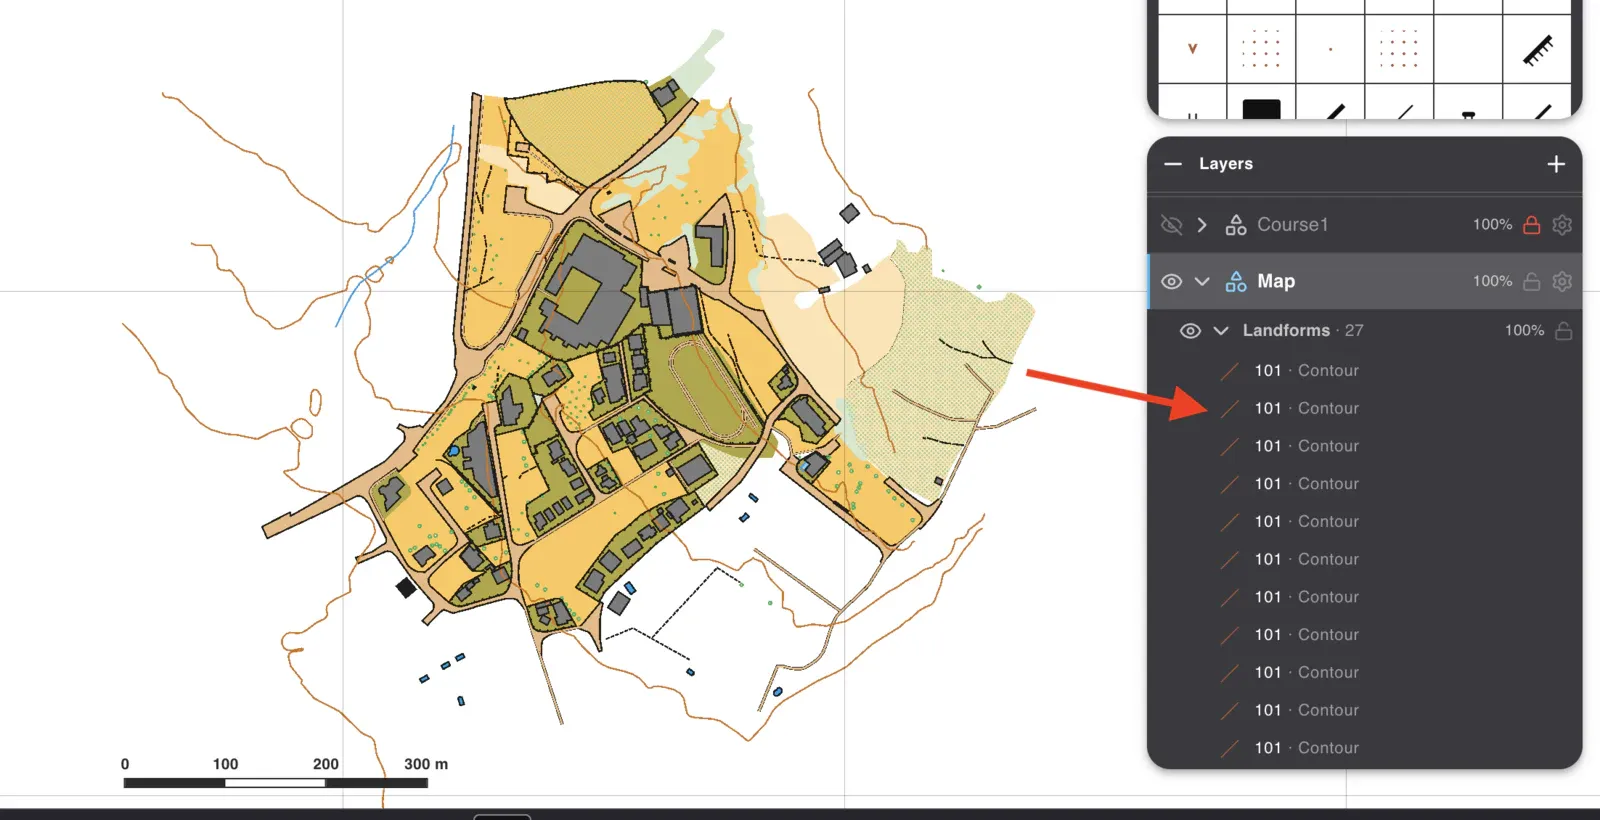
Here the contours were worth keeping. Select them on the imported layer and move them across.
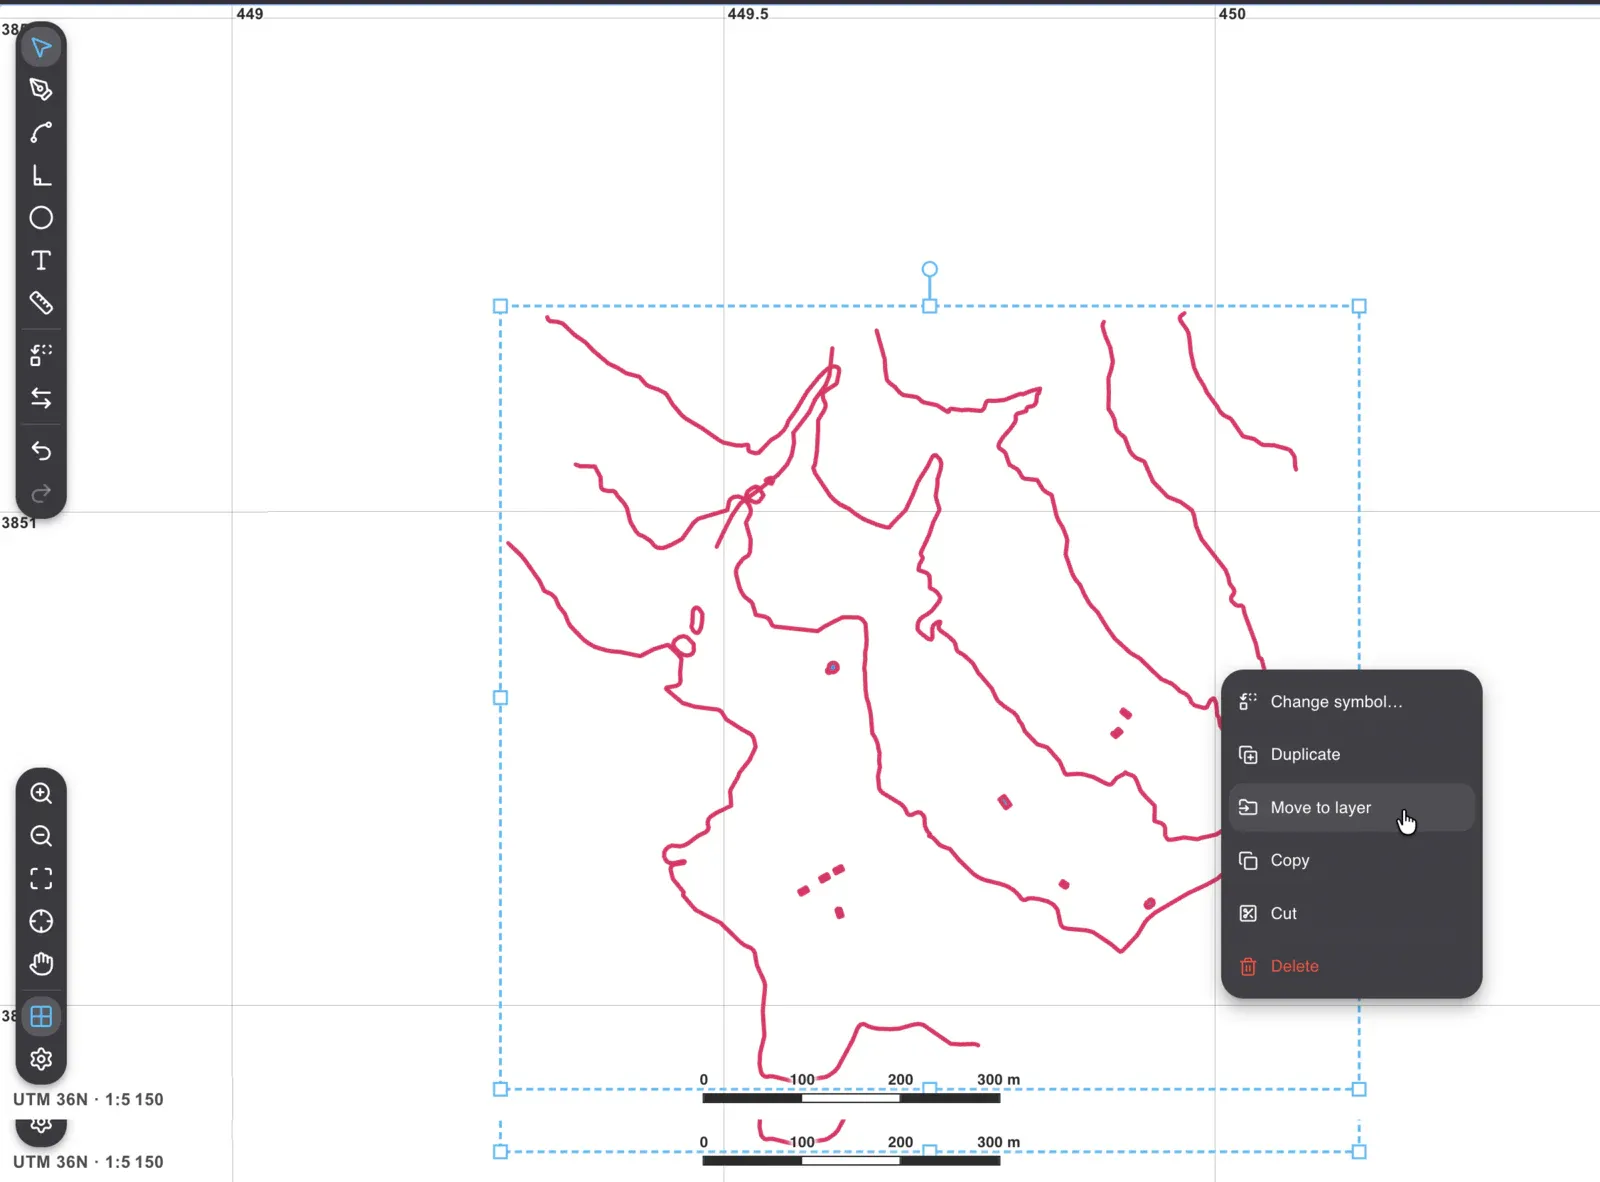
The two layers were drawn with different symbol sets, so the move asks what each symbol becomes on the layer it is landing on: 27 contours, 14 crossable watercourses, 10 bodies of water.
Draw
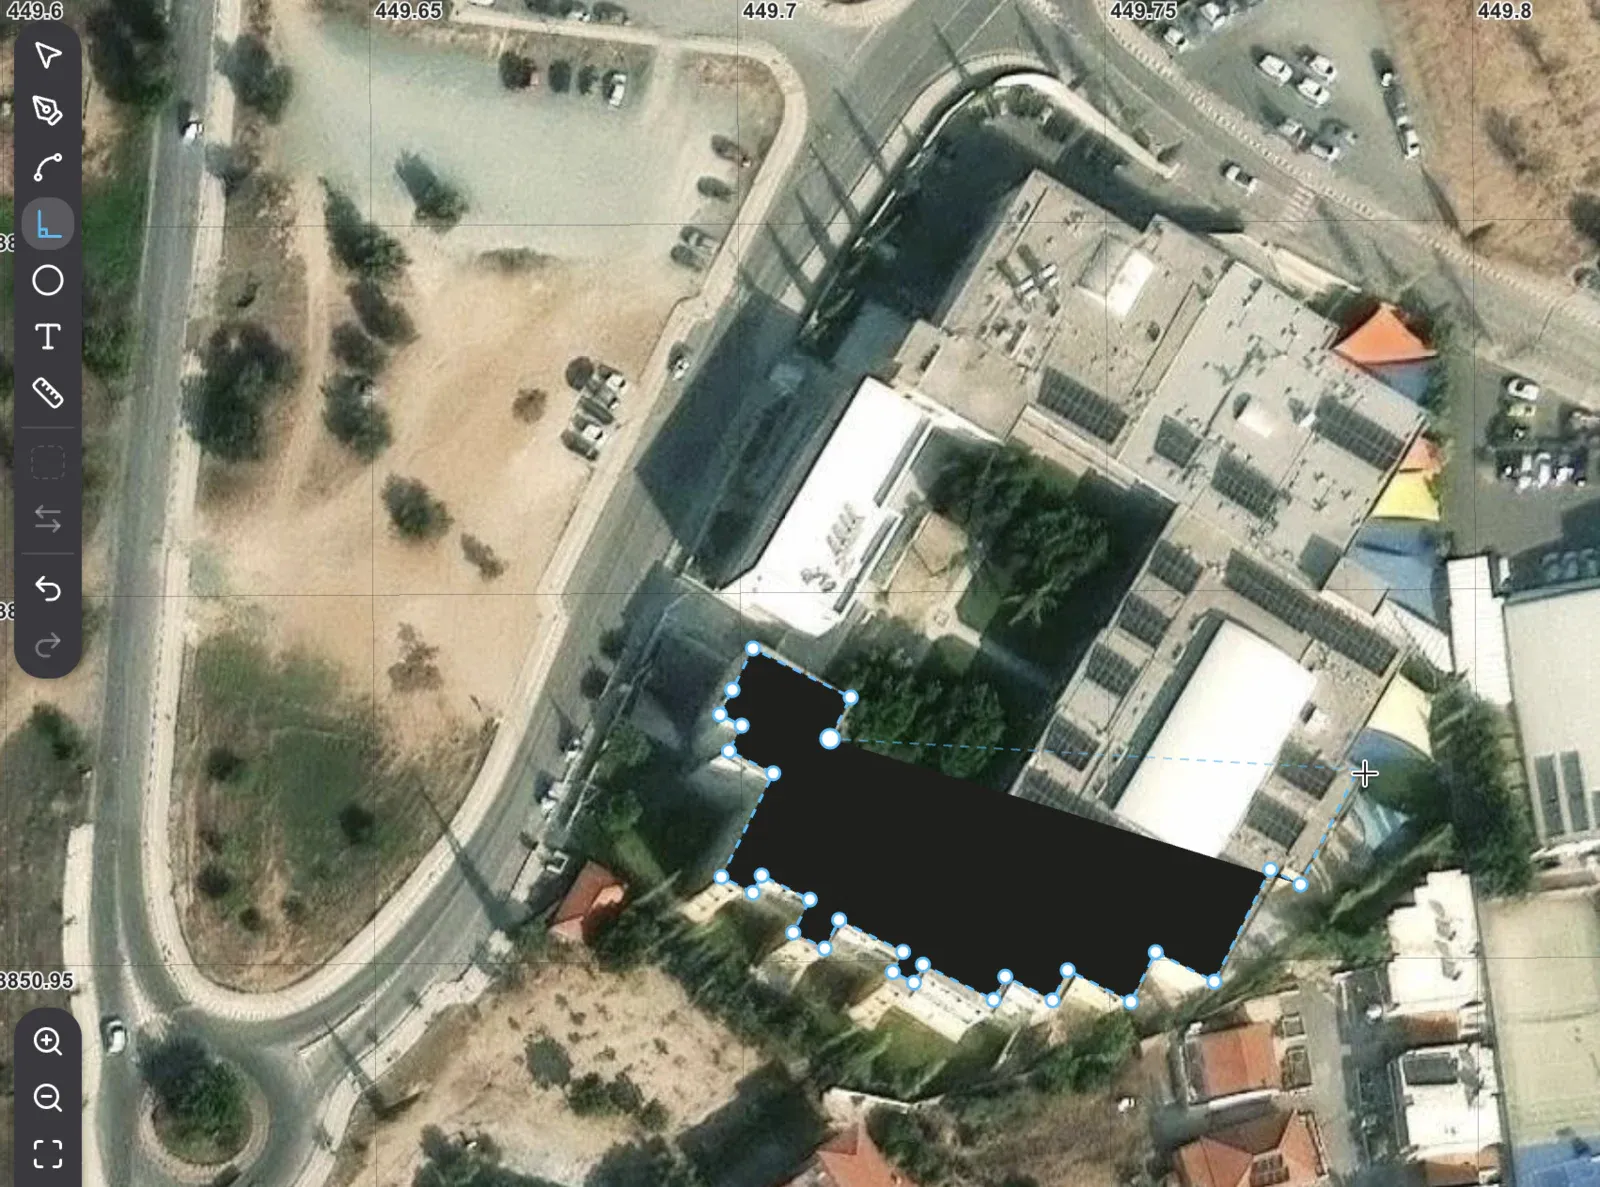
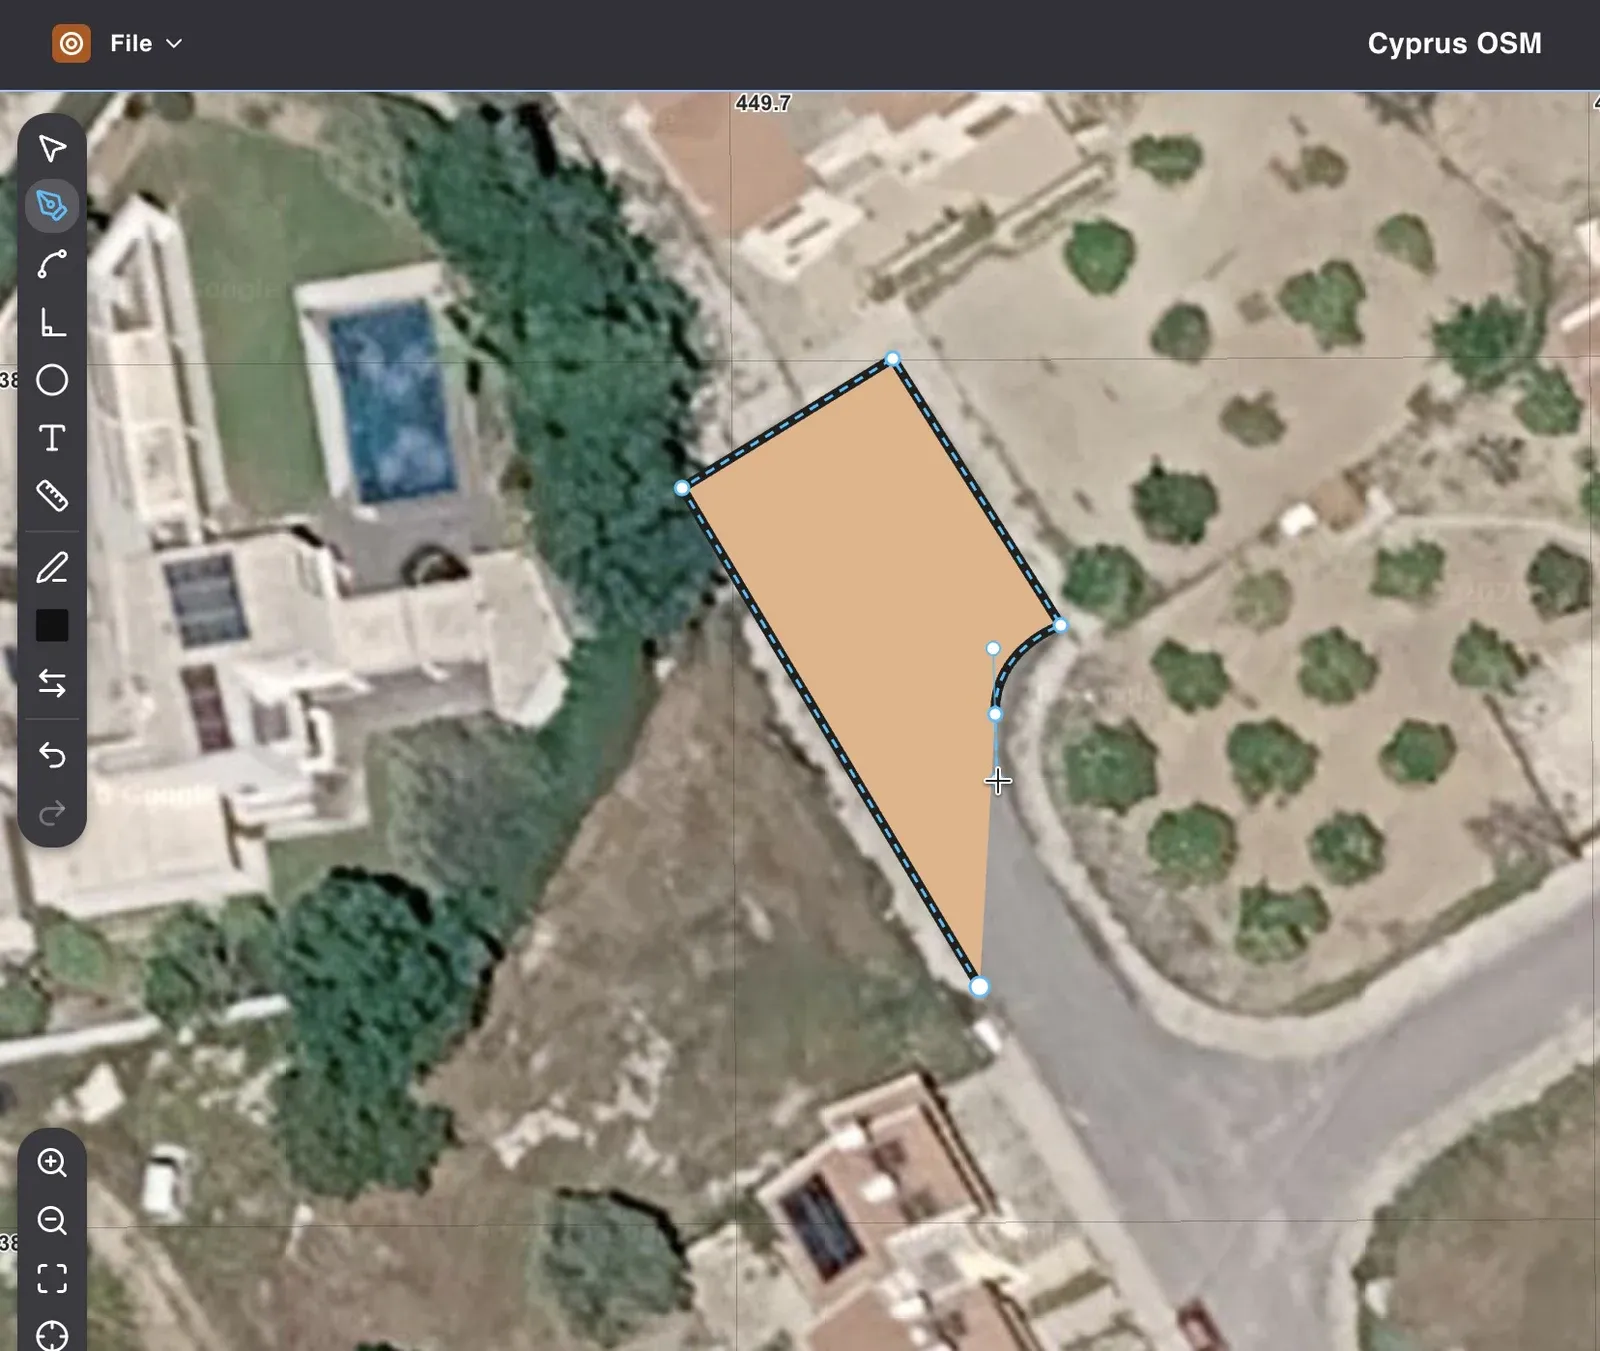
The symbol brings its own tool: choose a building and you are drawing right angles
You do not switch tools between symbols. Choose a building and the pen draws right angles; choose a road and it draws a smooth curve. Over 85 buildings that stops being a convenience and starts being necessary.
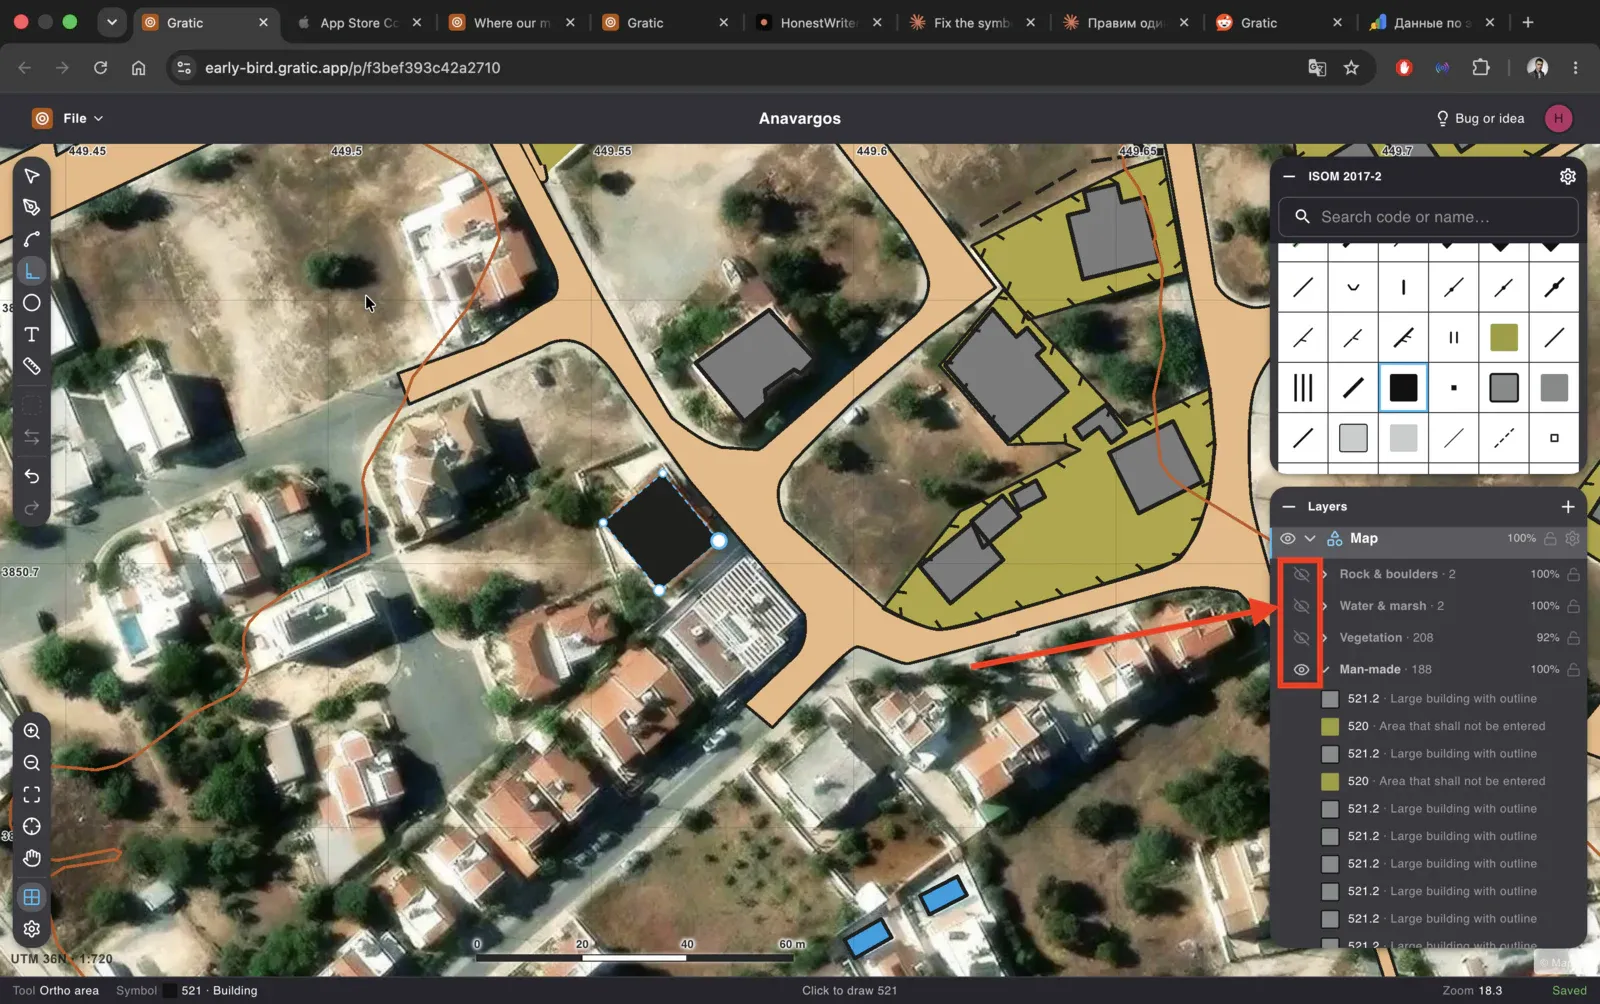
When a category gets in the way, switch it off for the layer and keep working on what is left.
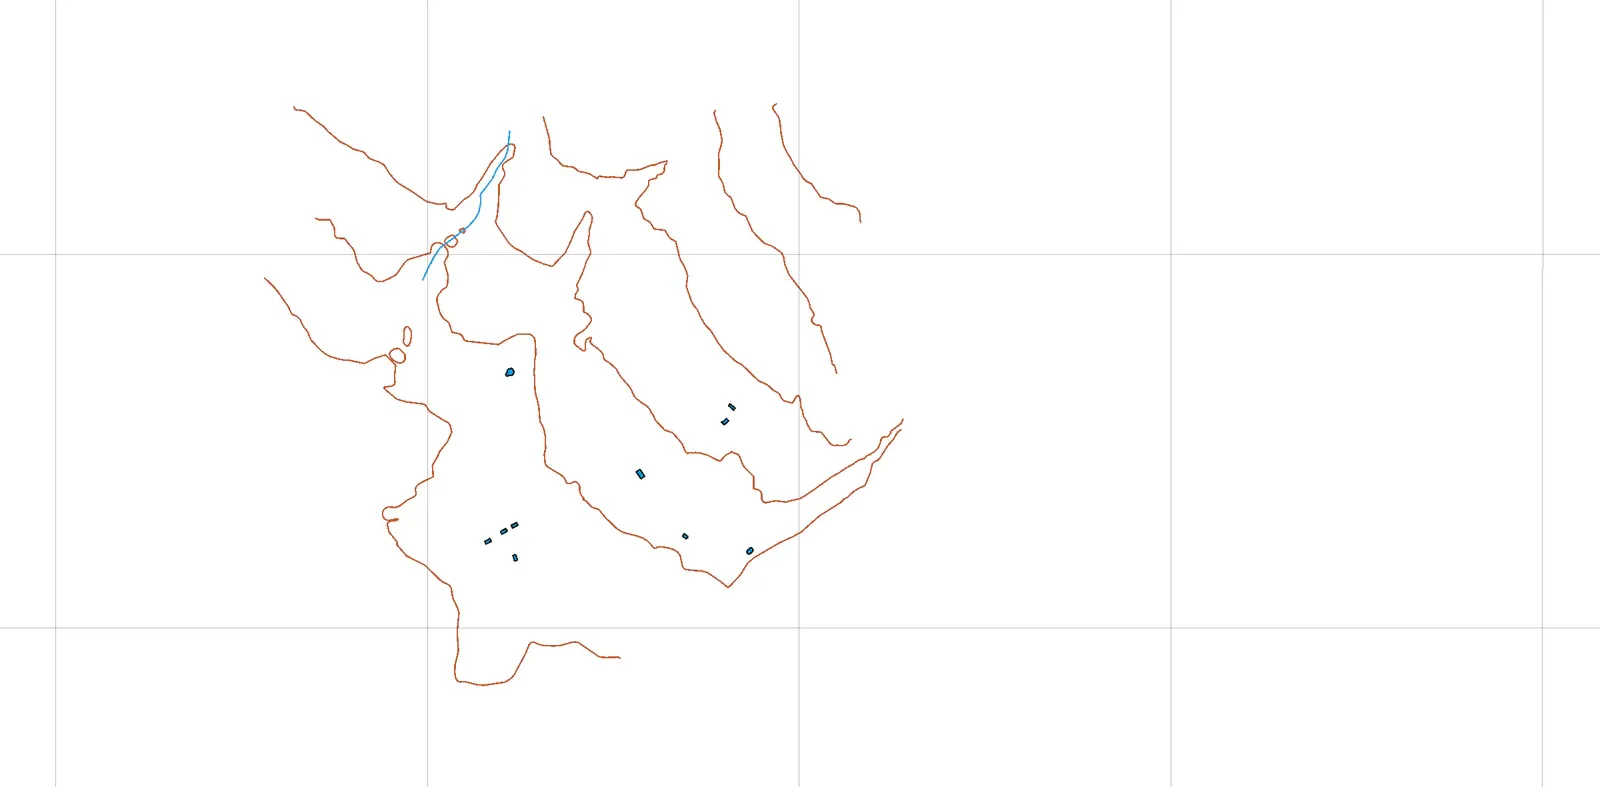
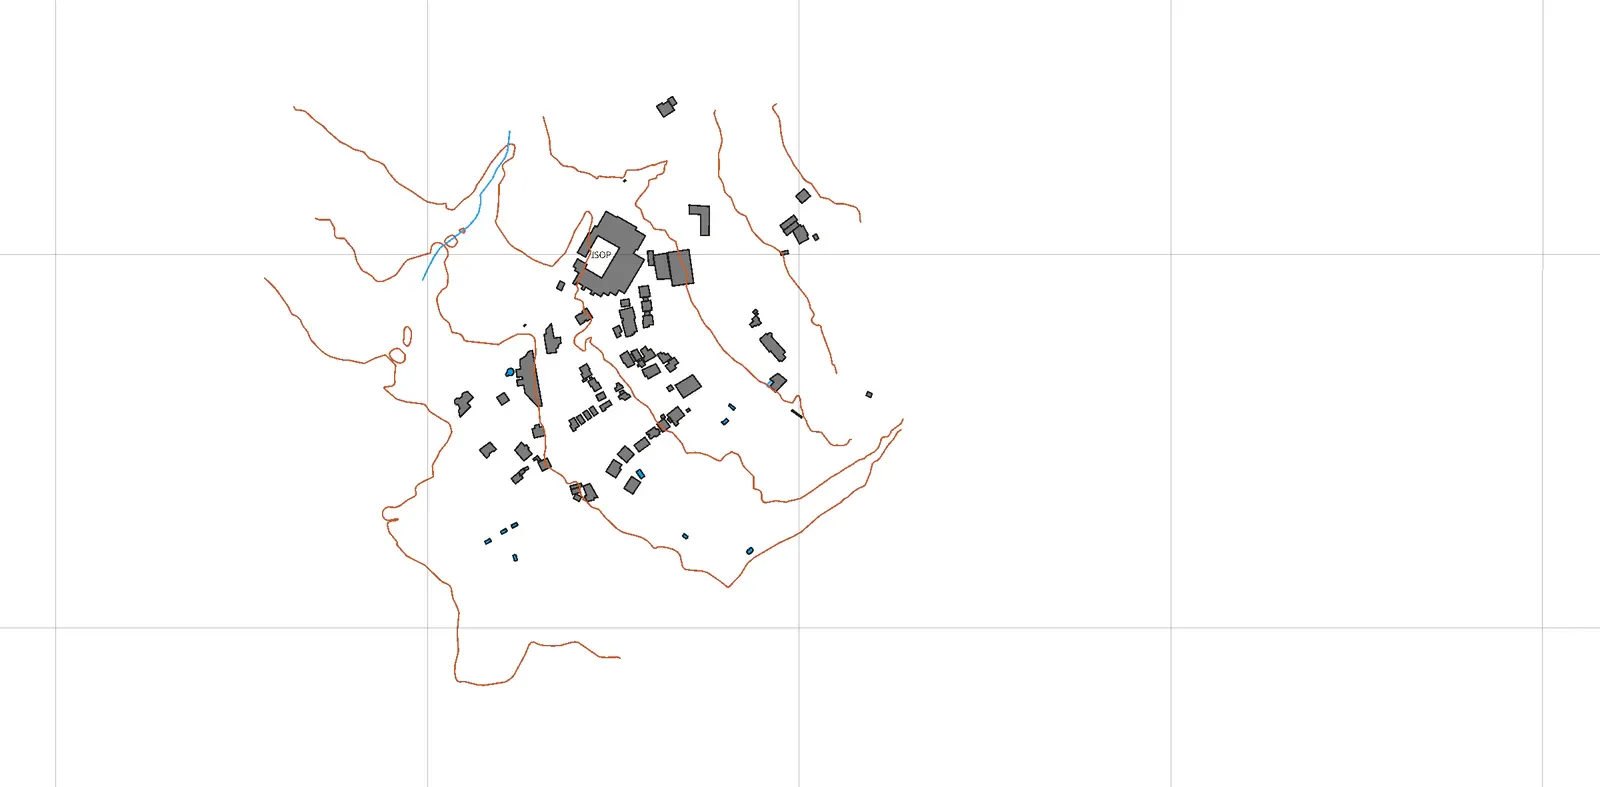
What it looks like as it grows
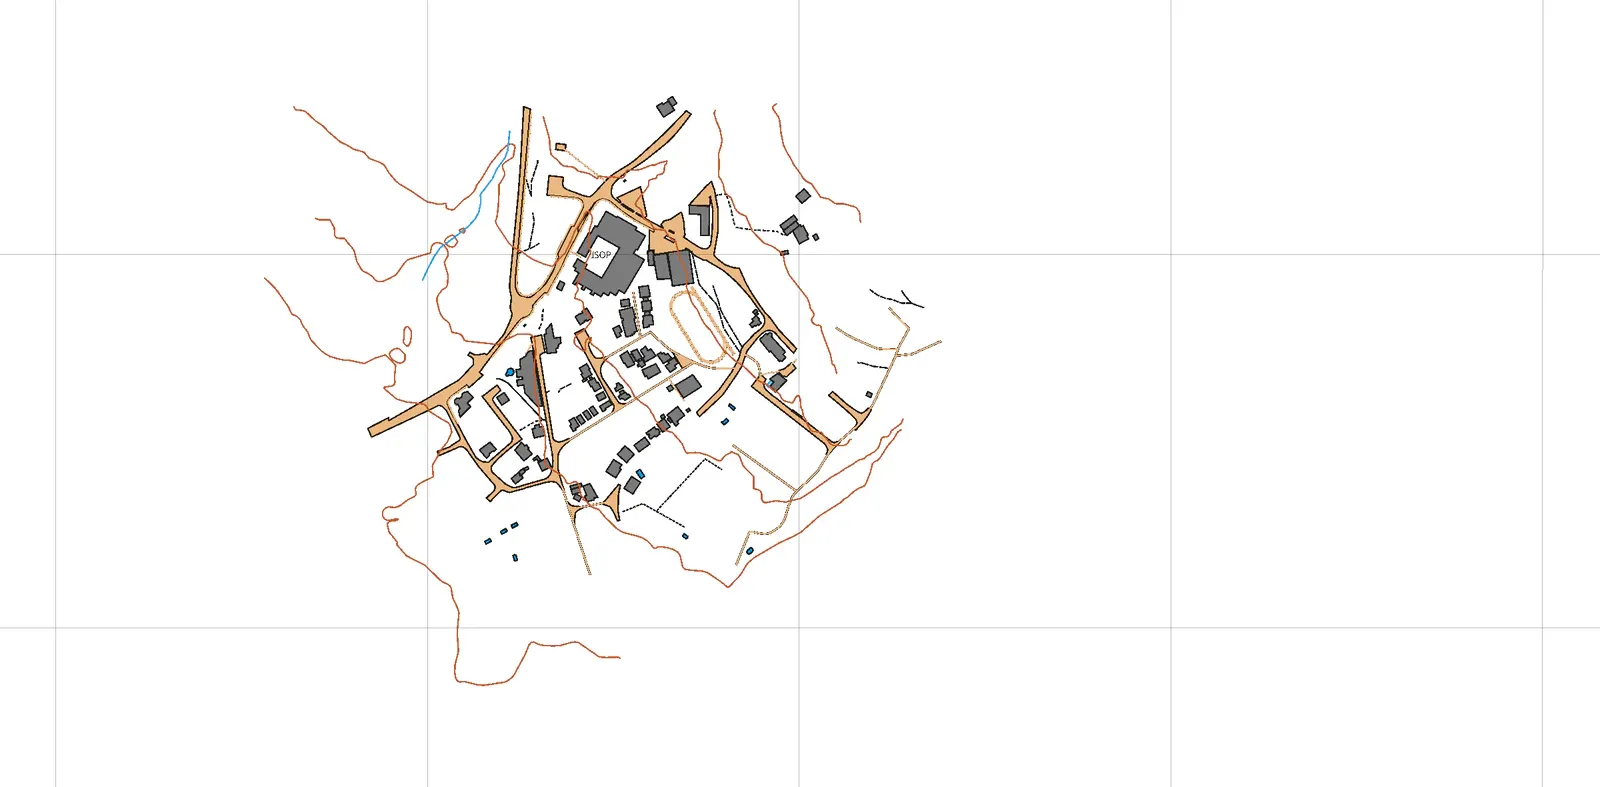
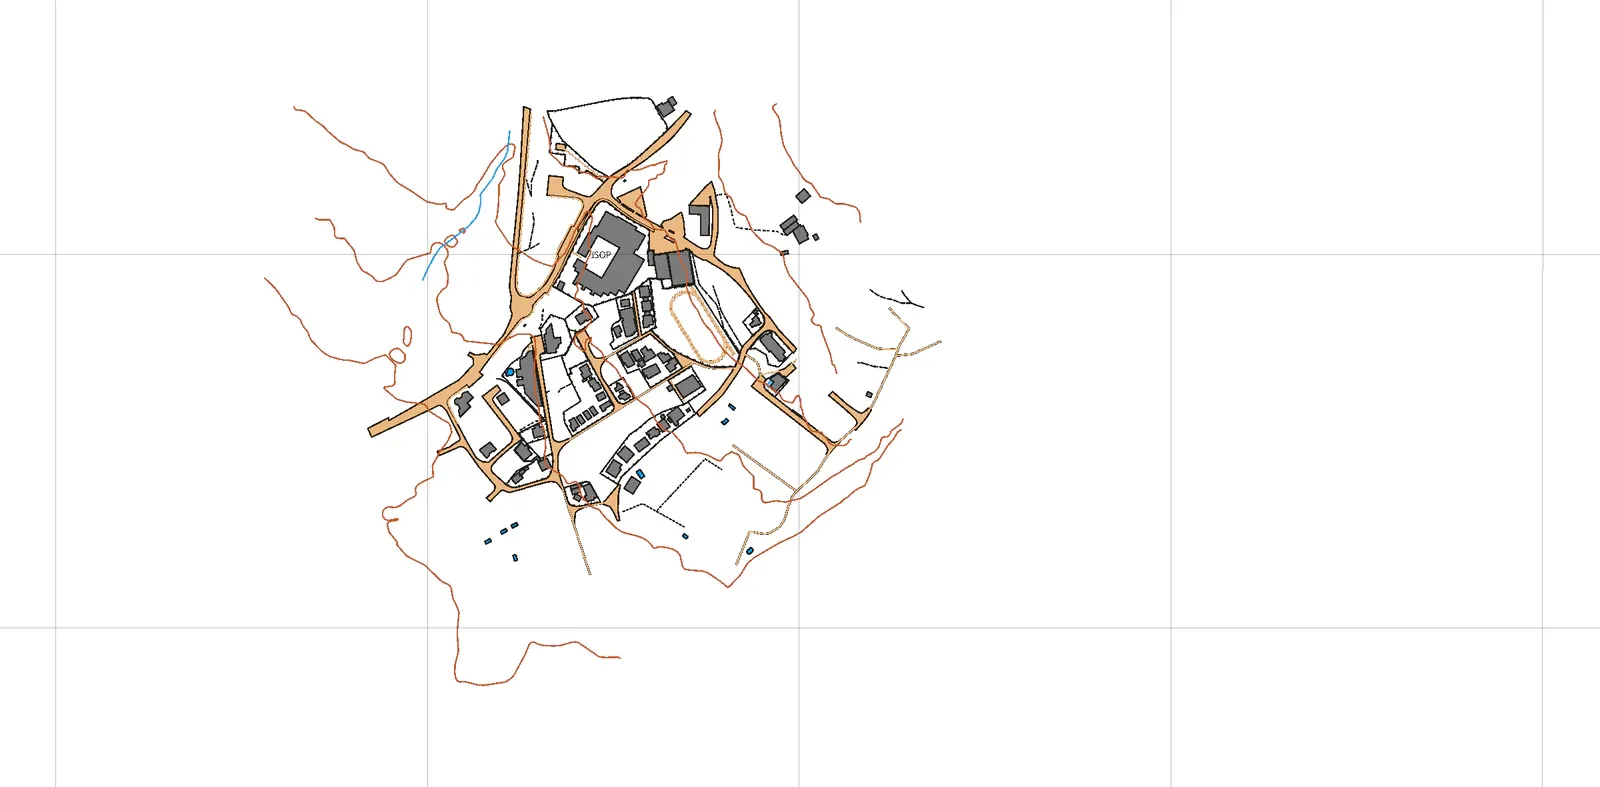
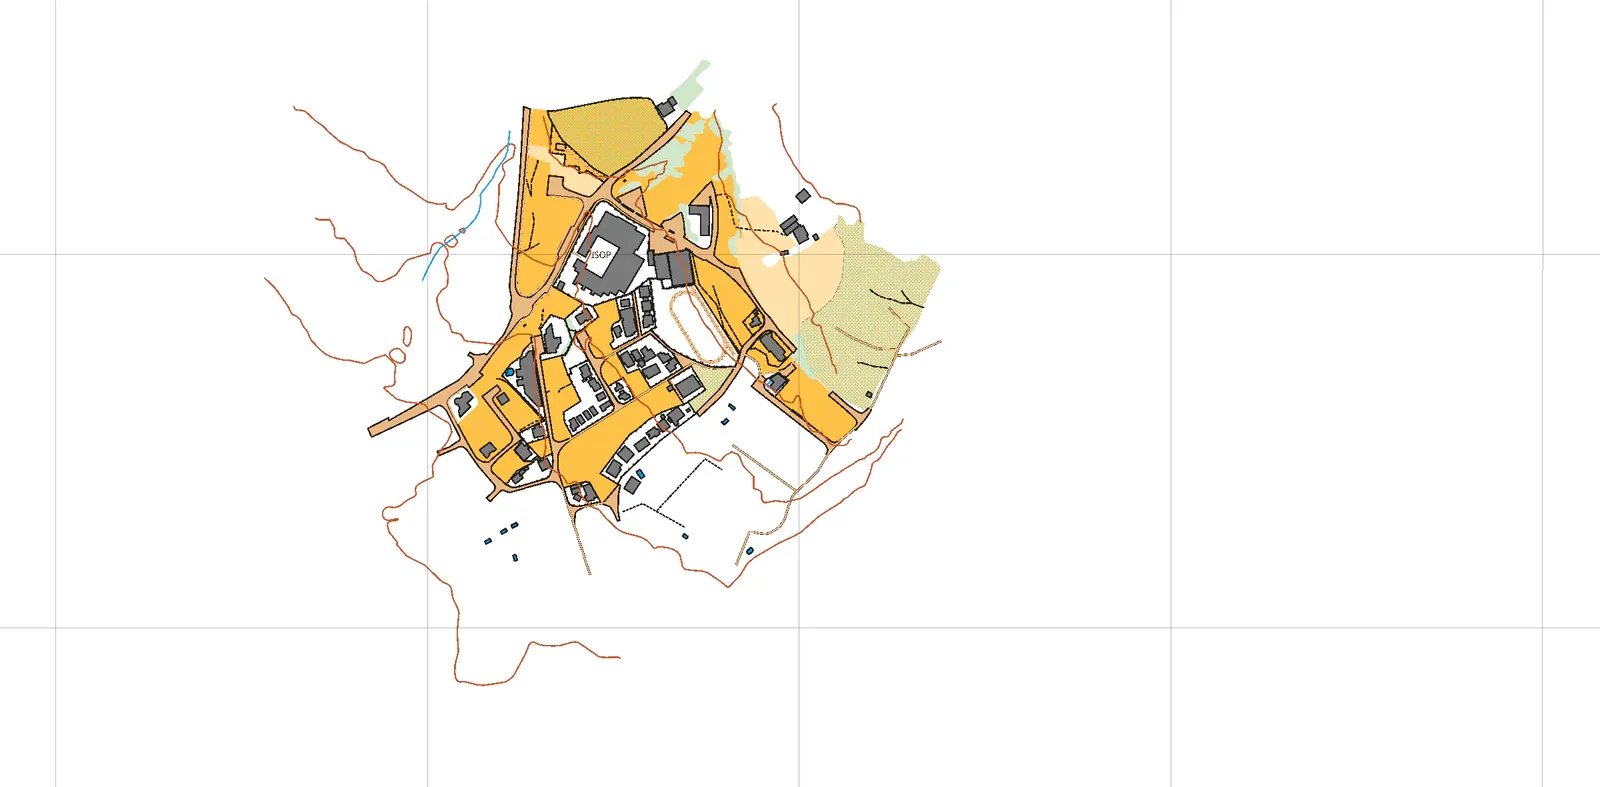
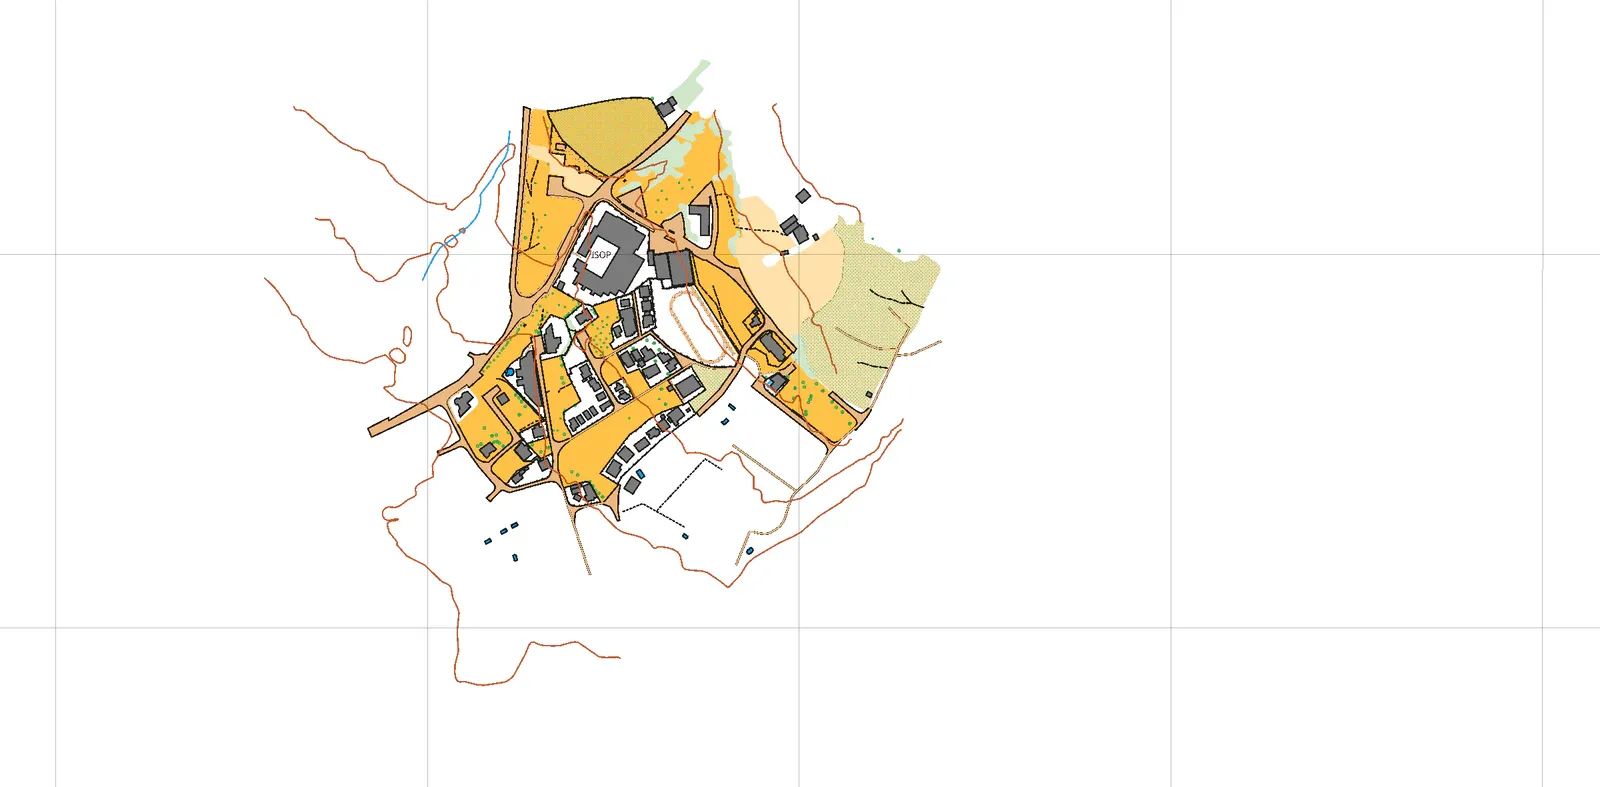
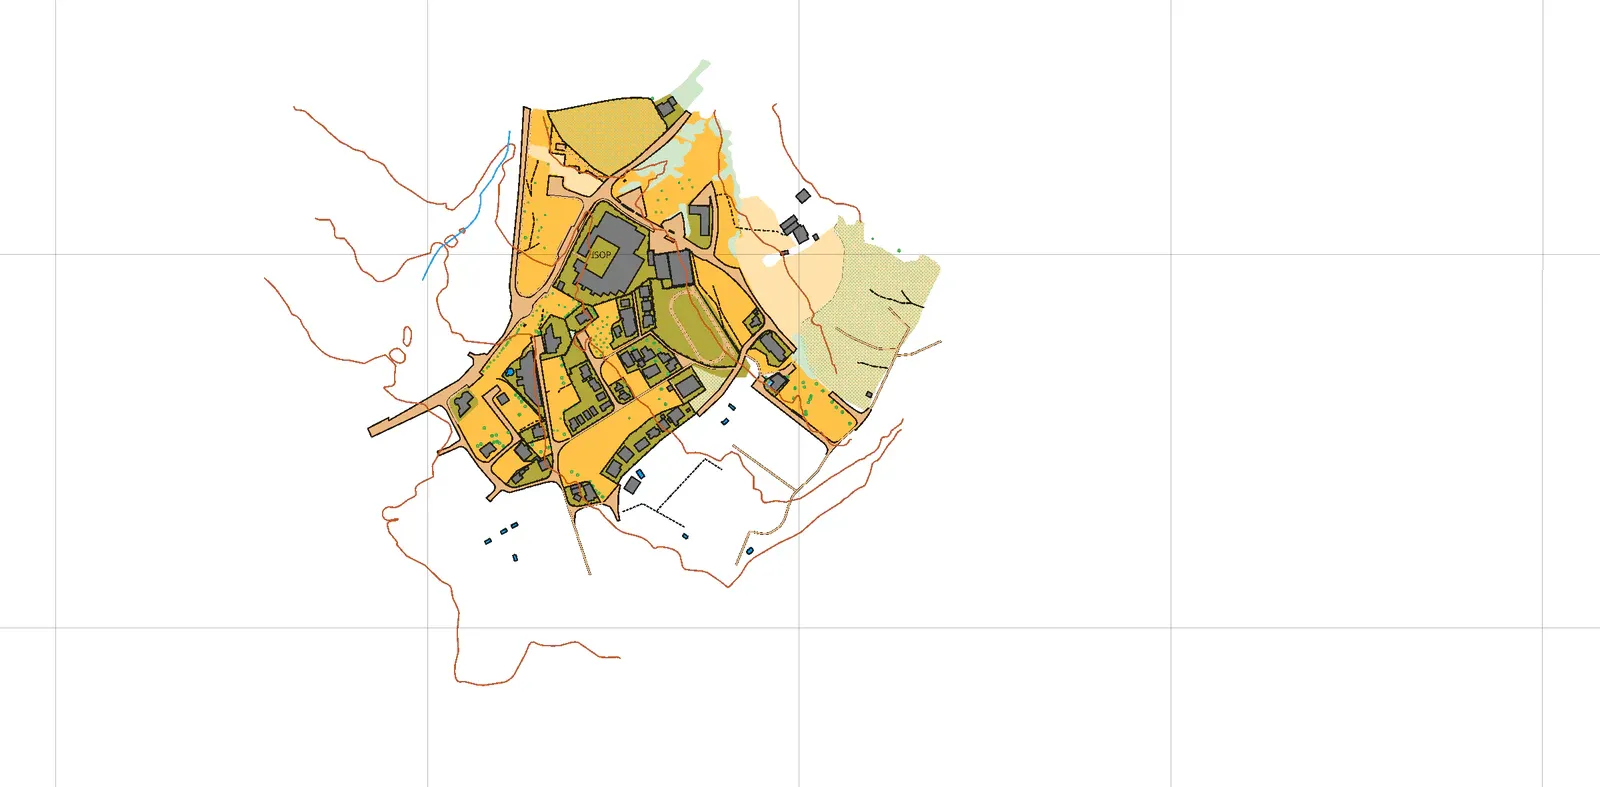
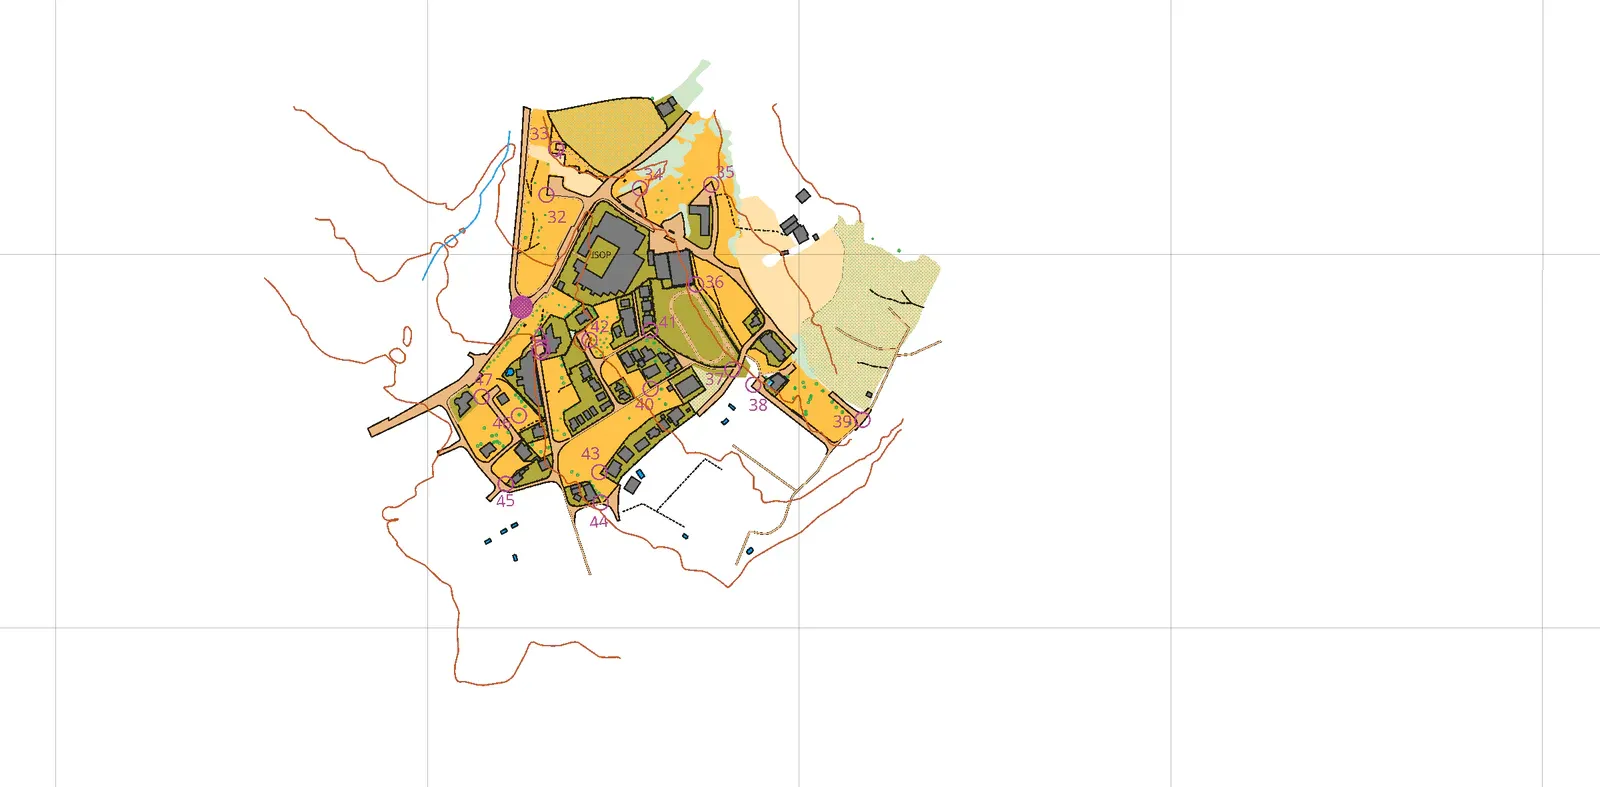
Most of the time goes on fixing, not drawing
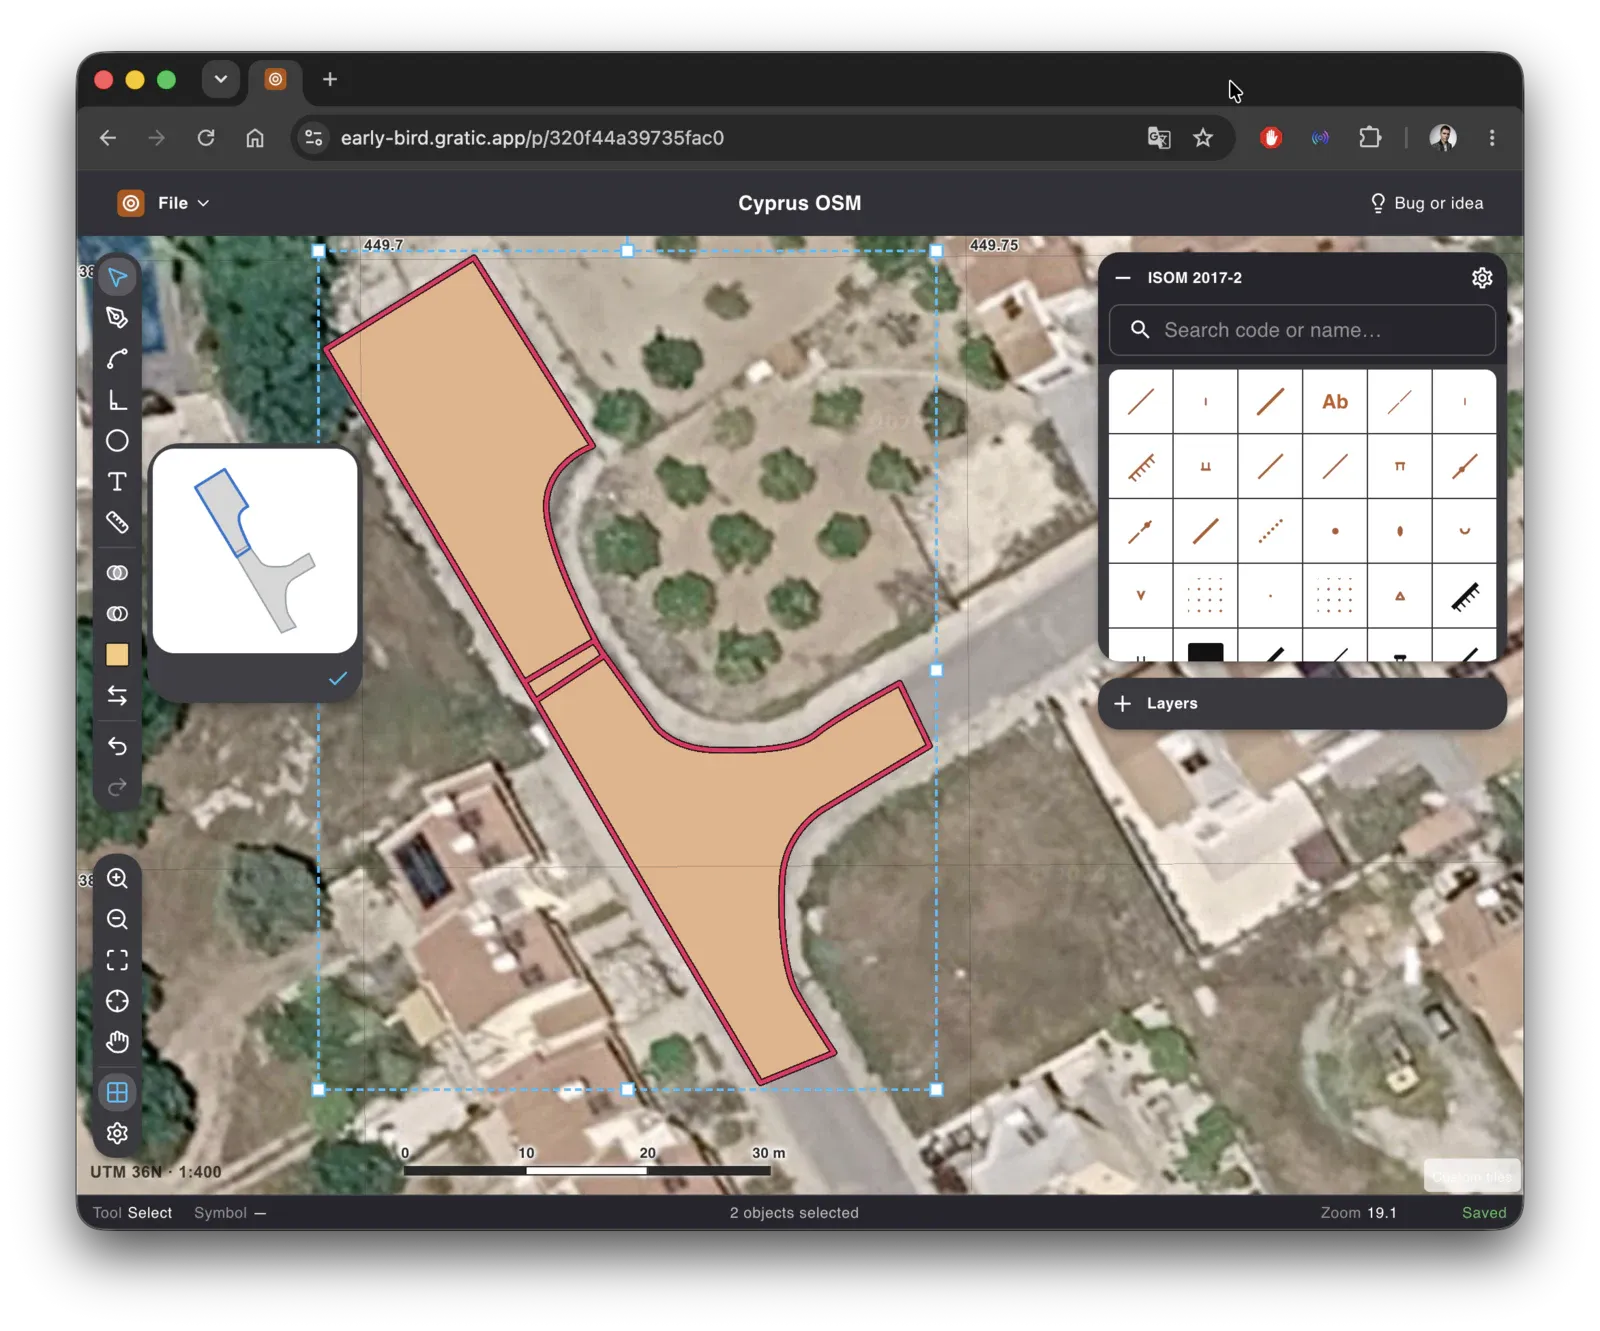
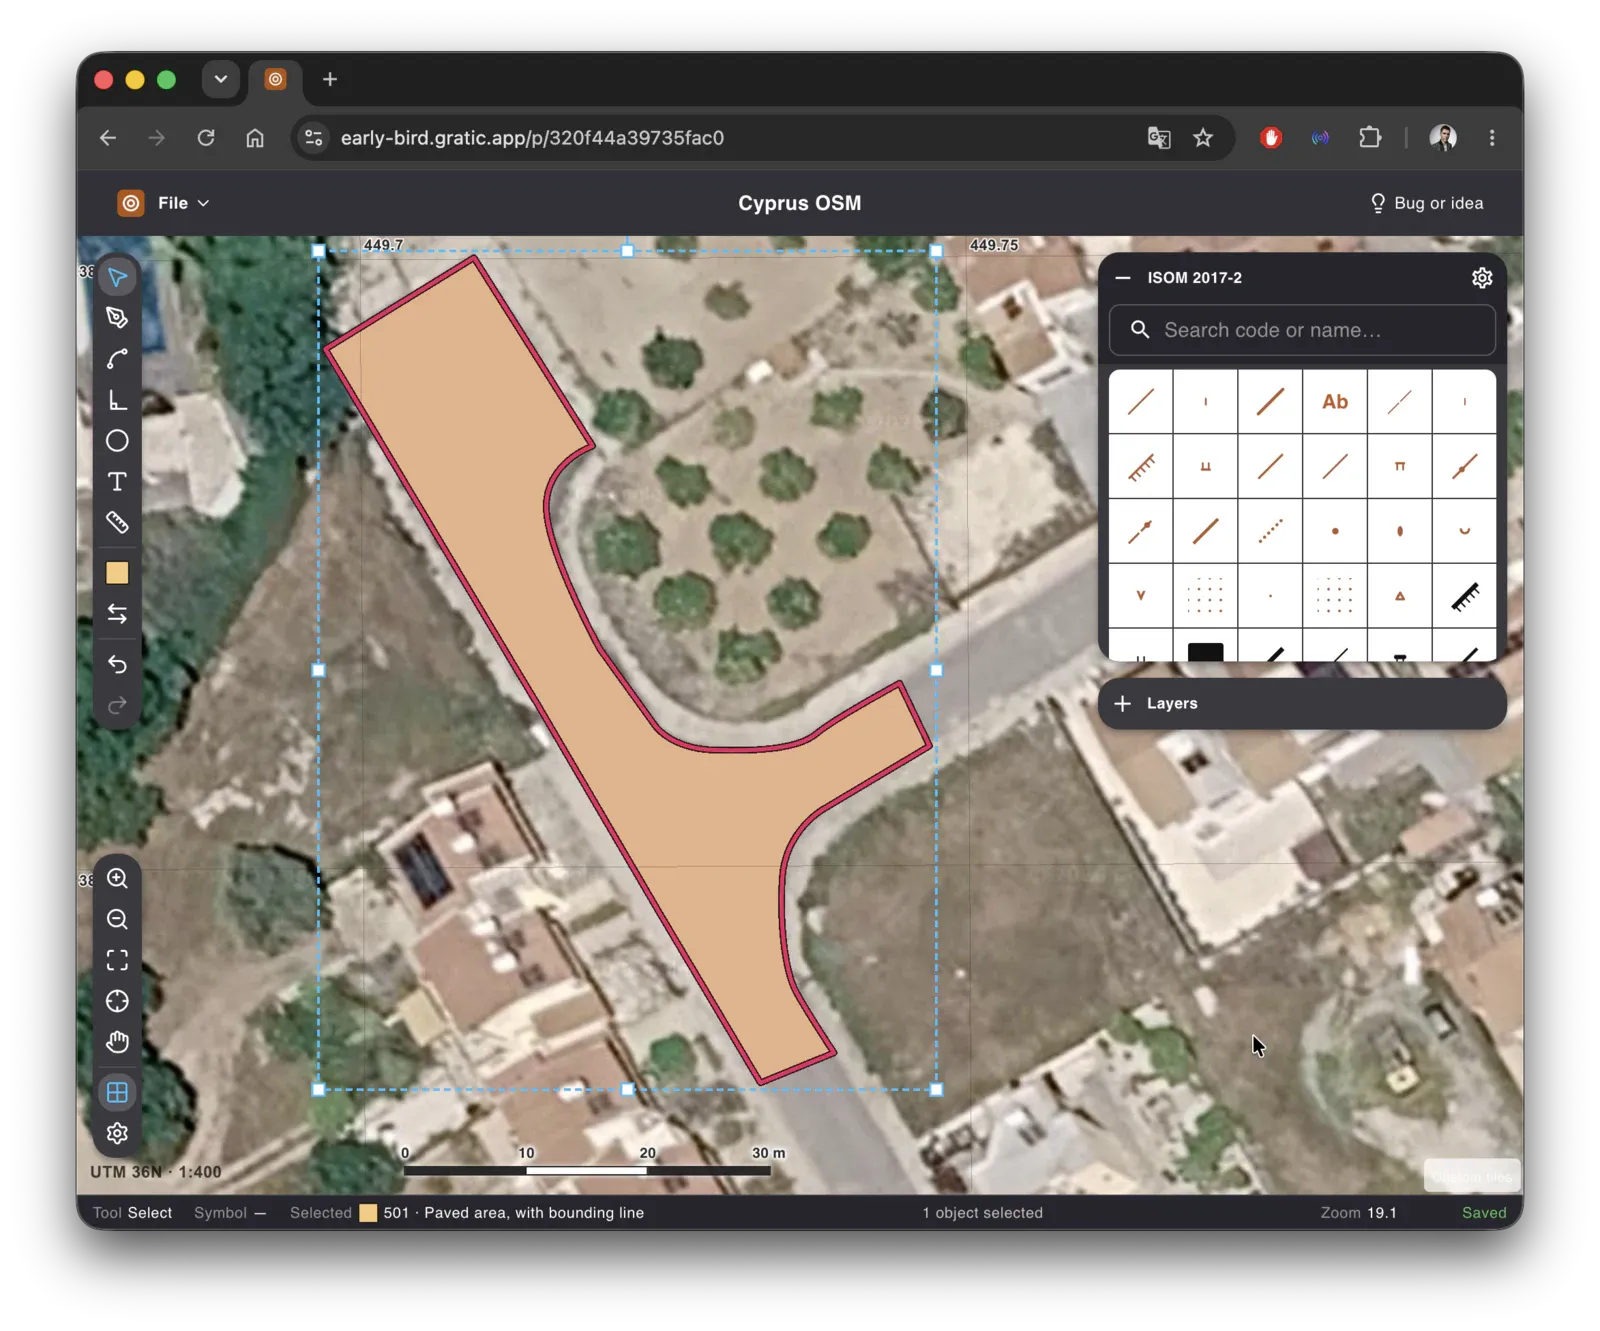
Most of the work is not drawing but fixing — nudging a vertex, cutting a line, changing the symbol under a whole selection
The first pass puts something on the map. Everything after that is correction: a fence half a metre into a wall, a path that should stop at the steps, two hundred bushes that turn out to be the wrong symbol and need changing in one go. Two areas that should have been one.
The sheet is its own editor
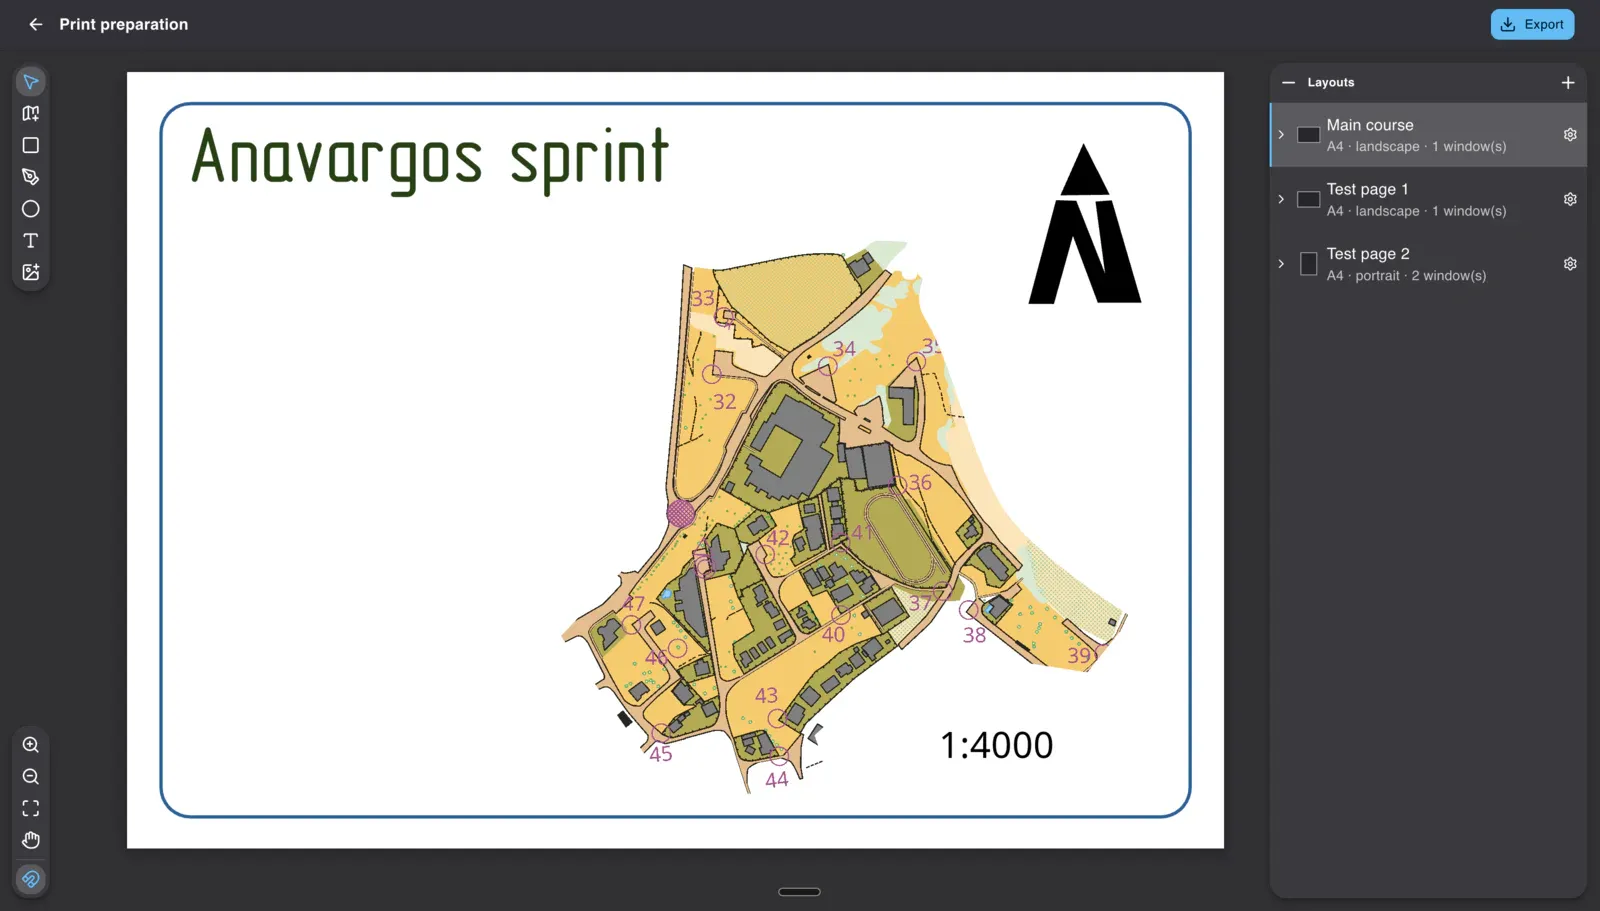
The sheet is its own editor: you place map windows on it, each with its own scale
A map becomes a map when it is printed. The sheet is a page in real millimetres, and what you put on it are windows onto the map. You pick the area for a window on the map itself, and the window can be a rectangle, an ellipse or a shape you draw.
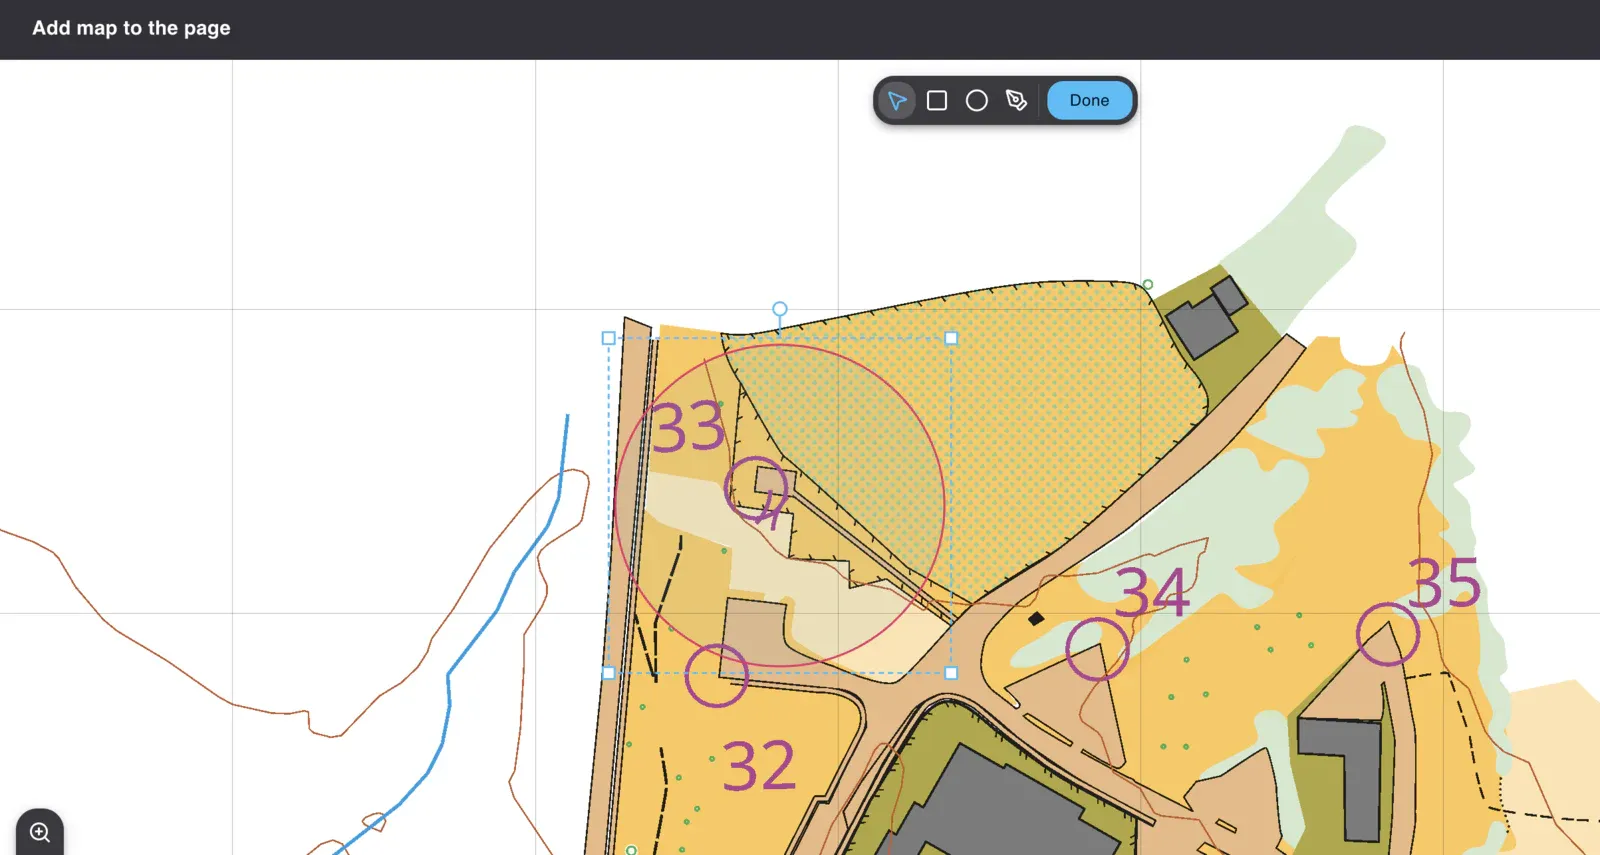
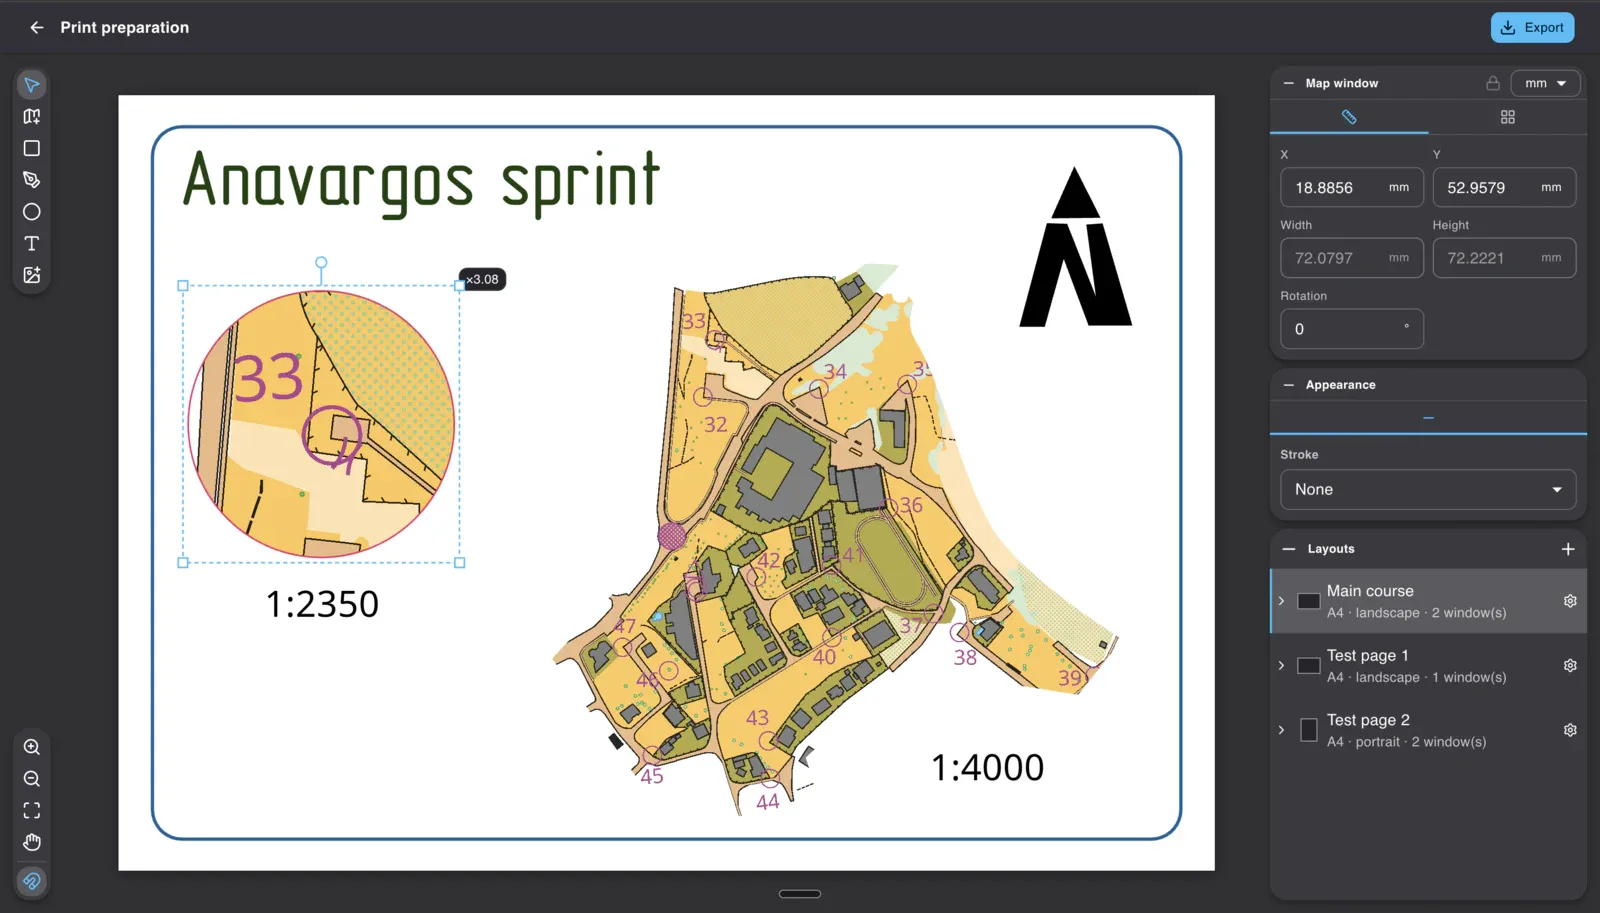
A second window is not a second file. Here it is the same map again, enlarged 3.08 times to 1:2350, cut to a circle, on the same page. Each window carries its own position and size in millimetres, and its own rotation.
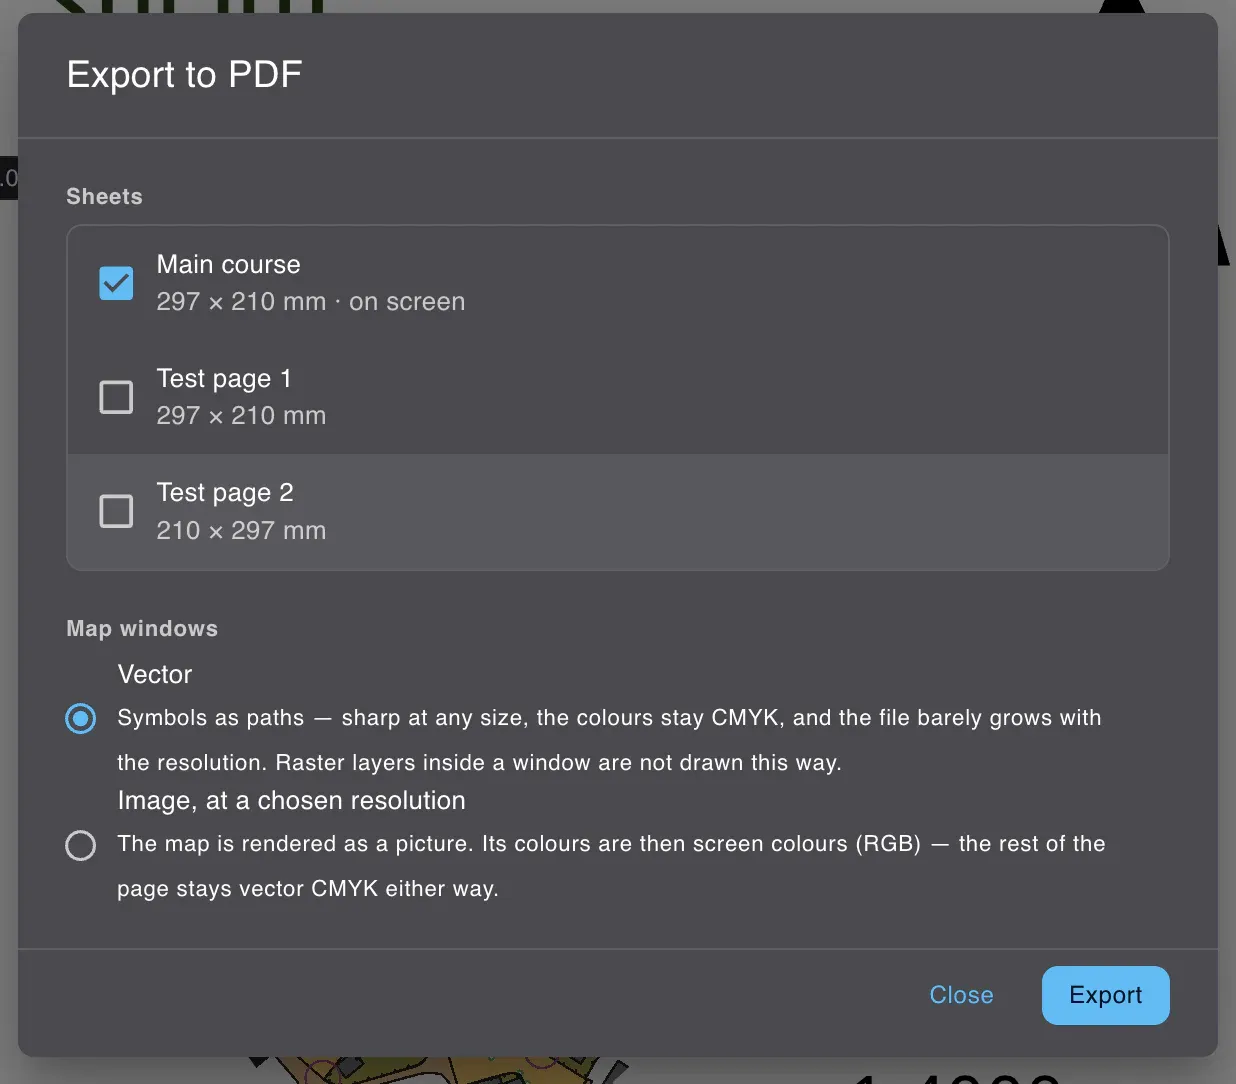
The page goes out as PDF, and the map windows can go either as vector paths, keeping the CMYK inks the symbol set defines, or as a picture at a resolution you choose. The rest of the page stays vector either way.
The controls, on one screen

There is a sheet of gestures in the File menu, and it switches between a trackpad and a mouse. It is a picture you open to learn the controls rather than a place to rebind them.
Two people, one map
Two mappers draw the same map at the same time, which is the one thing a desktop editor cannot do
Two people open the same map and draw at once, from different machines, and there is one copy of it. No master file, no date in the filename.
Getting the map out, not just the page
The PDF above is what goes to the printer. The map itself leaves as a map file: .omap for
OpenOrienteering Mapper, carrying the symbol graphics — the glyphs, the patterns, the dashes — and the
georeferencing with its declination.
There is an OCAD export too, and it is worth saying exactly what Gratic does today: the file opens, the objects are there, the colours are there, the coordinates are there. The symbol graphics are a work in progress, so check a file before you rely on it for a print run.
The map is real, the steps were reconstructed
The map above is one small sprint map, and it is not a demonstration built for an article. It is the map, with the mistakes fixed and the out-of-bounds argued over. The step-by-step pictures were made afterwards, by taking the finished map apart, one symbol category at a time.